In this NetApp tutorial, I’ll give you an overview of the performance in ONTAP storage systems. Scroll down for the video and also text tutorial.
NetApp ONTAP Performance Overview Video Tutorial
Harkirat Singh

I studied for around 30 hours before clearing the exam.
I was able to get all my doubts cleared. I always go through your training videos for NetApp whenever i want to clear my doubts again and again and to revise concepts in a short span of time.
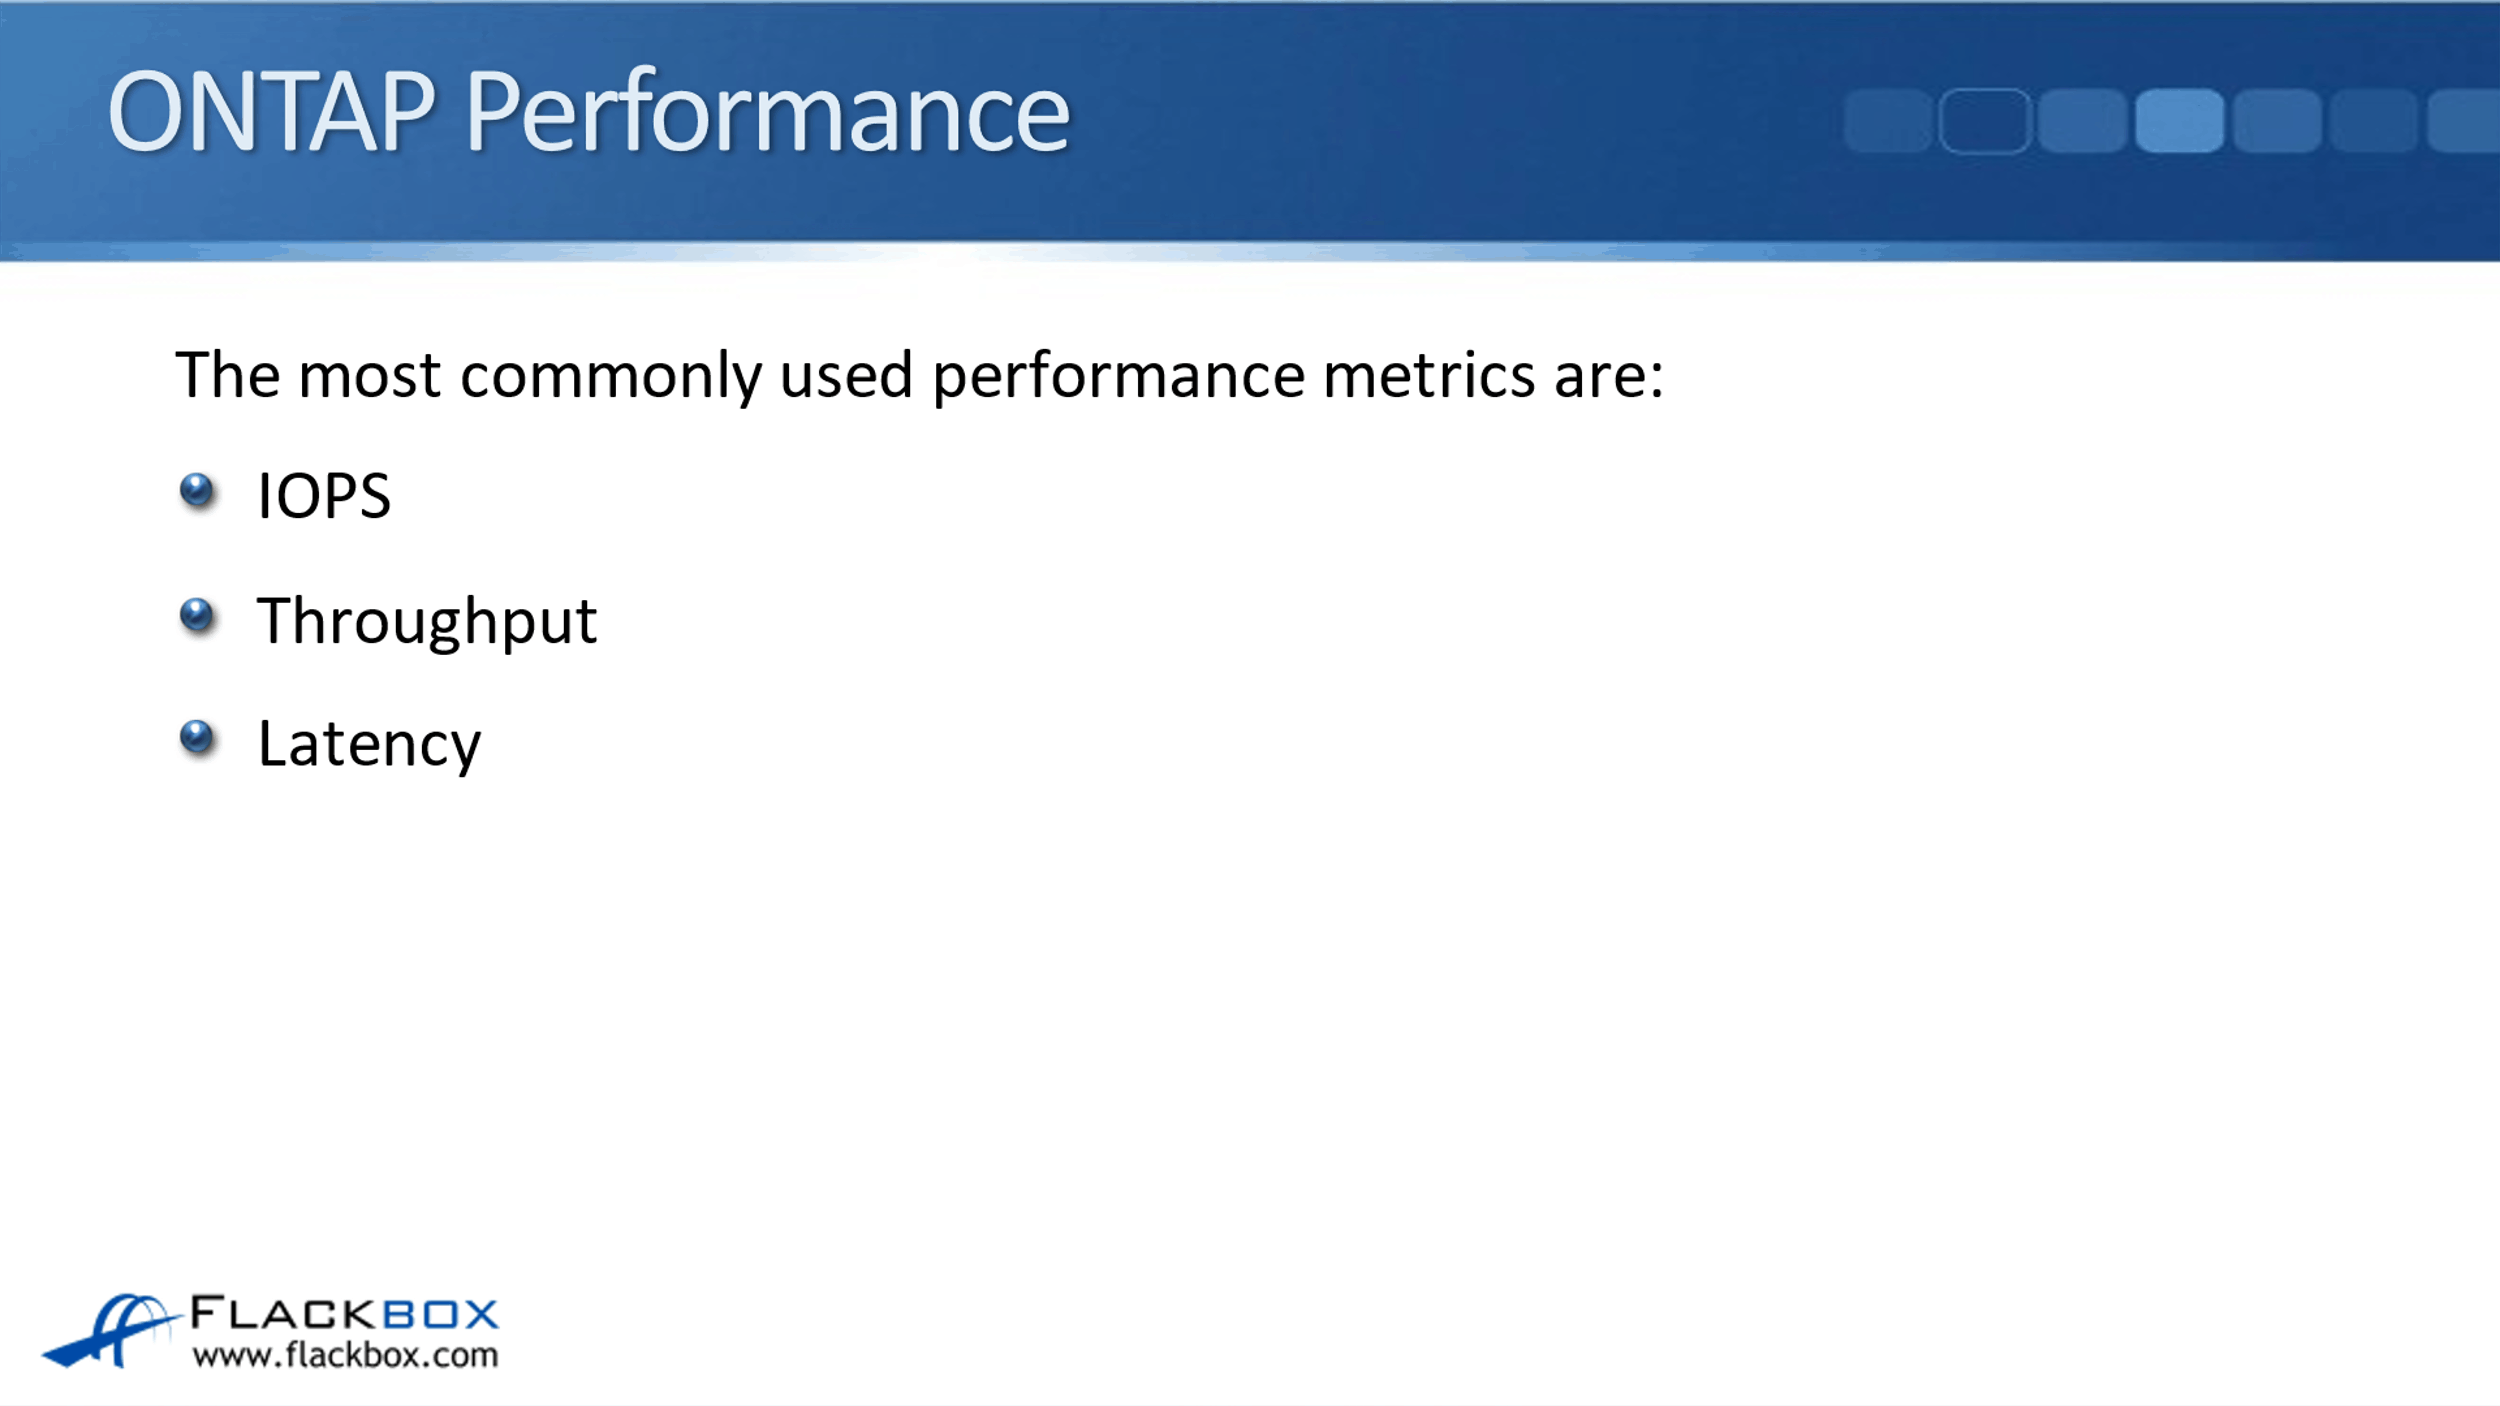
ONTAP Performance
The most commonly used performance metrics for monitoring and evaluating the performance of storage are IOPS, Throughput, and Latency.
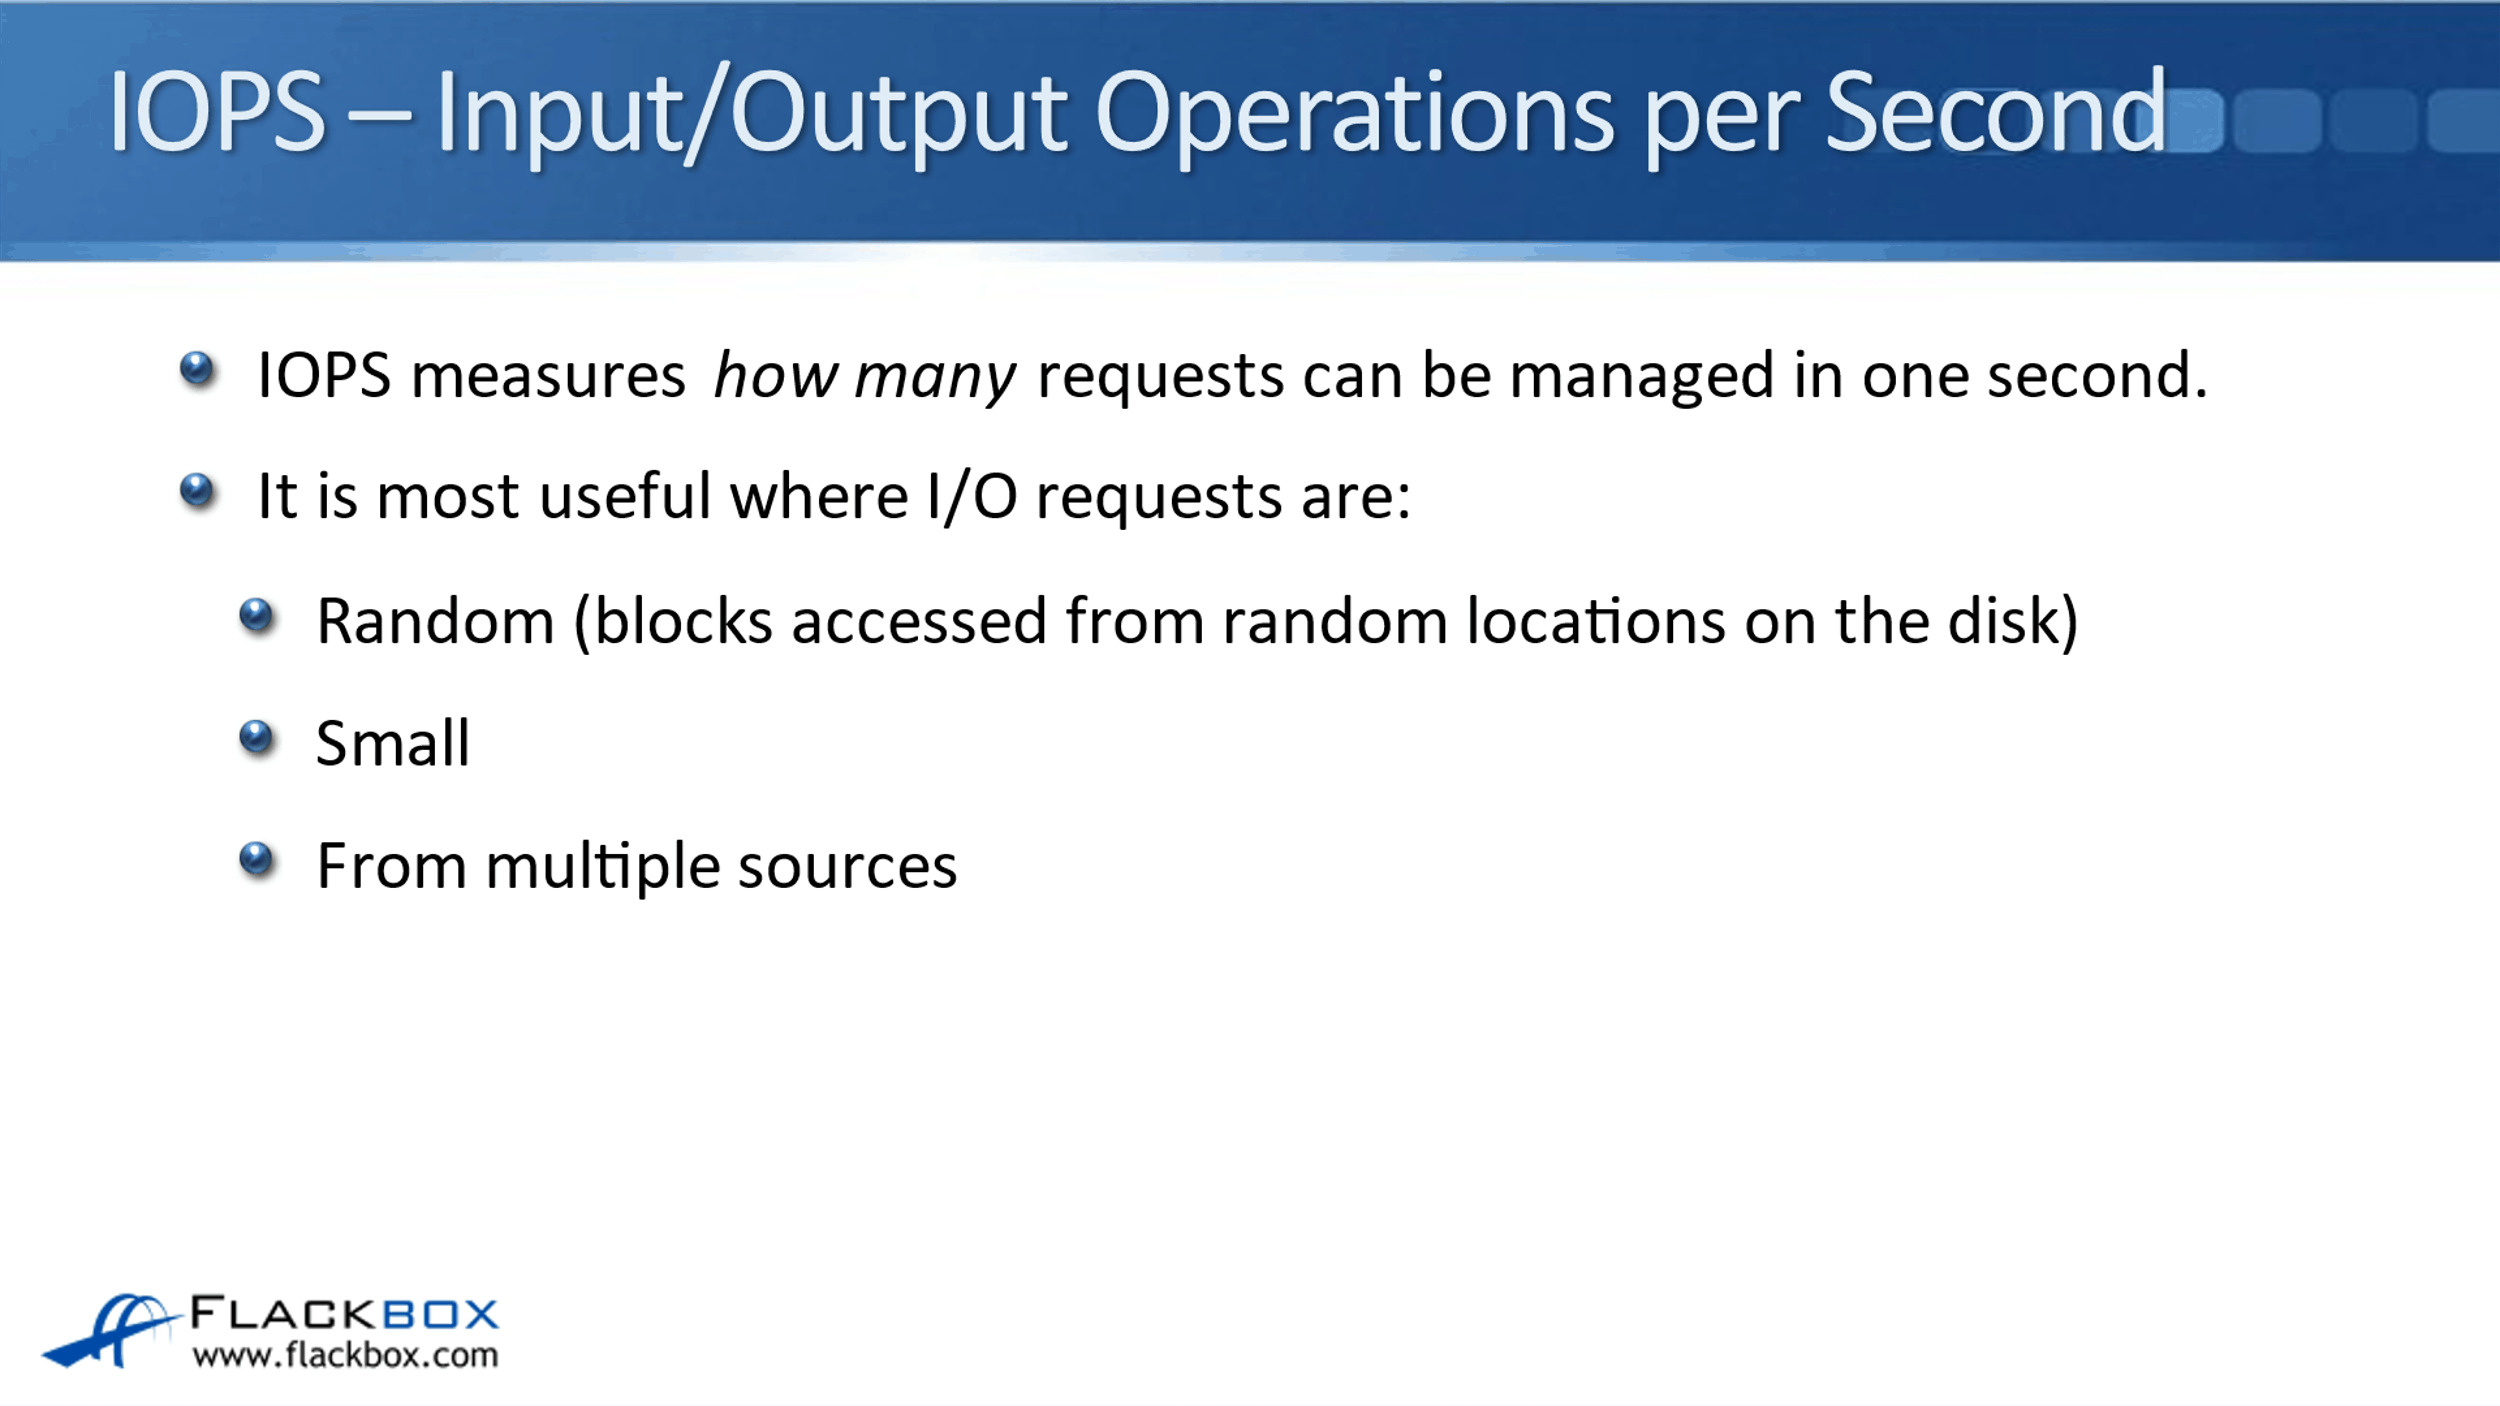
IOPS – Input/Output Operations per Second
The first one Input, Output, Operations per Second (IOPS), and this measures how many requests can be managed by the system in a second. It's most useful to use this as your metric where I/O requests are random as opposed to sequential, so, the blocks are accessed from random locations on the disk. They're also small and from multiple sources.
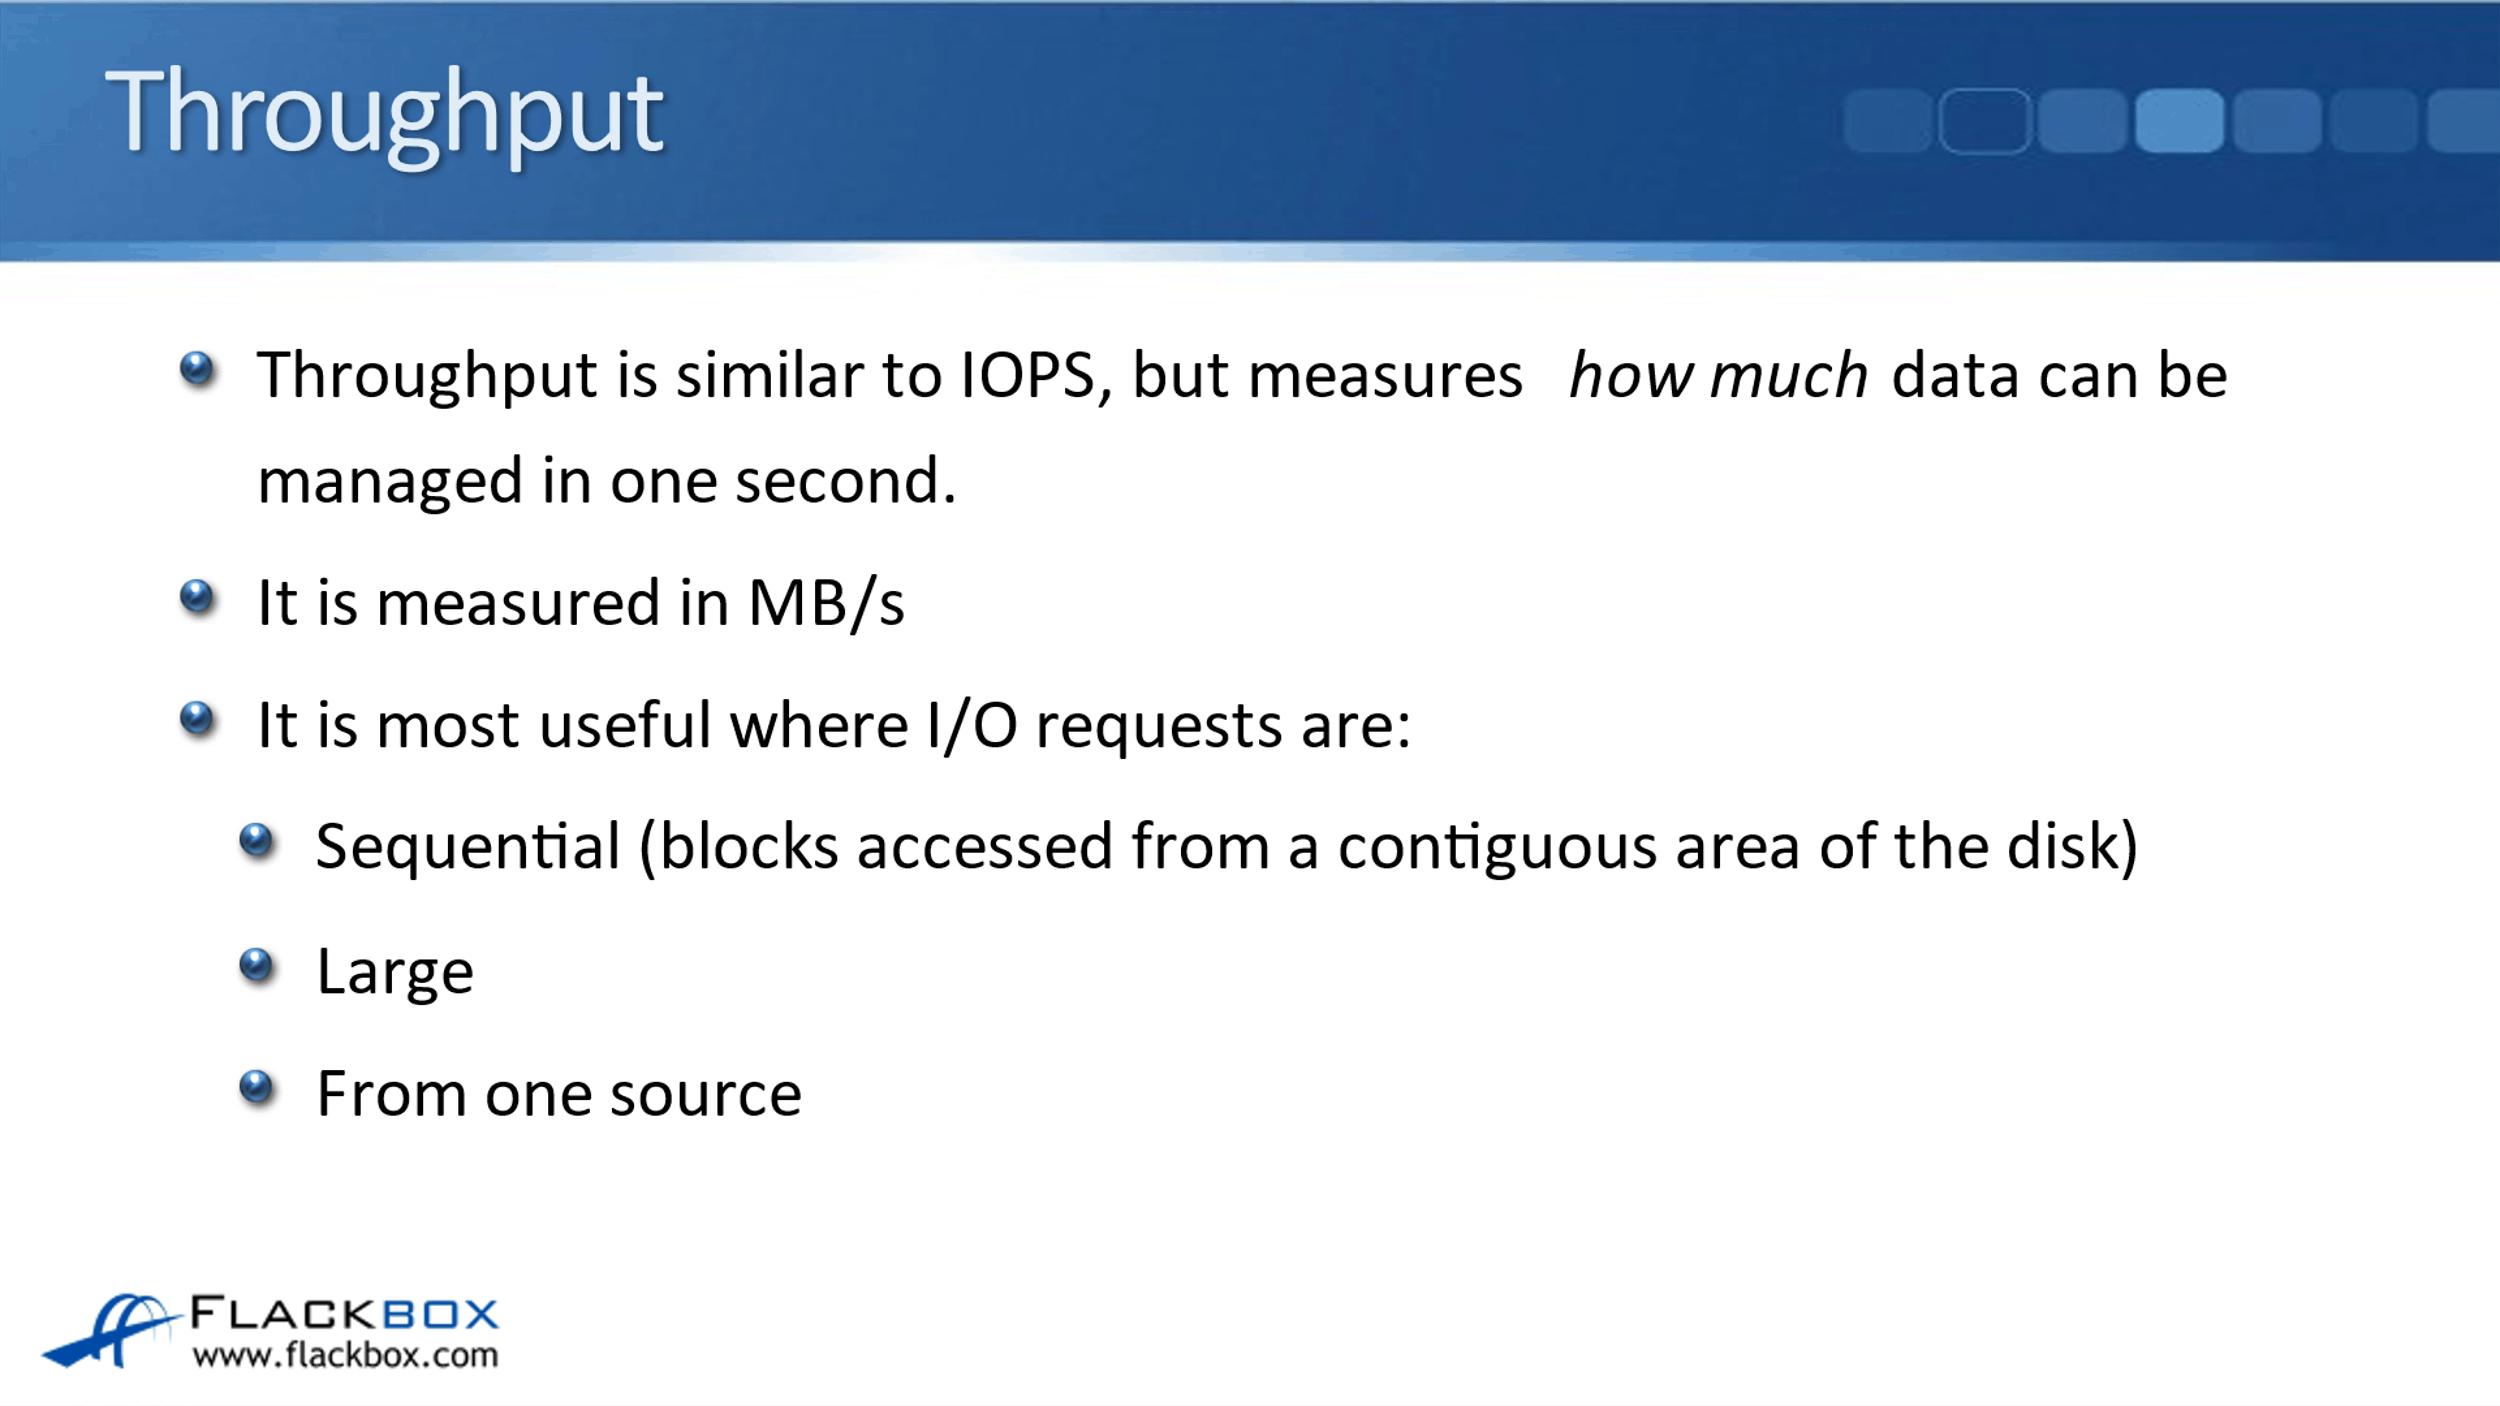
Throughput
The next one that we have is throughput. It is very similar to IOPS, but it measures how much data can be managed in one second. It takes size into account. Throughput is measured in megabytes per second, and it's most useful where the I/O requests are sequential, where the blocks are accessed from a contiguous area of a disk where they're large and from one source.
With IOPS, it is measuring how many requests are managed in one second without giving an indication of the size of the request and the number reported. But obviously, the larger the request, the smaller the amount of IOPS you'll get.
This is most useful where the I/O requests are small and the size is not so important. Where the requests are large, we do want to take that into account. Therefore, throughput is the more relevant metric then.
Latency
The last really important metric that we have is Latency. Latency measures how long data processing takes. The client sends in a read or a write request to the storage system, how long does it take for the storage system to process that request and also acknowledge it. Latency is measured in milliseconds or with modern systems now in microseconds.
Workload Characteristics
Another thing that we need to consider is the characteristics of the actual workload application that is using the storage. Different workloads can and will have different characteristics. For example, the mix between reads and writes. You may have one workload which is 80% reads and 20% writes. You may have another workload which is the other way around, 20% reads and 80% writes.
That's going to have an on the performance because the storage system is able to process reads more quickly than it can process writes. Other characteristics to consider about the workload are the mix between random and sequential requests.
Again, you might have one workload, which is mostly random requests, and another one which is mostly sequential requests, the storage system can handle sequential requests much quicker than it can random. That's also going to cause a big difference in the meaning of your metrics as well.
The last one is the block size used by that particular workload. Because of this, you're going to see different performance for different workloads because those workloads have got different characteristics. You're going to see better performance for the workload that is mostly read requests than for a workload that is mostly write requests, for example.
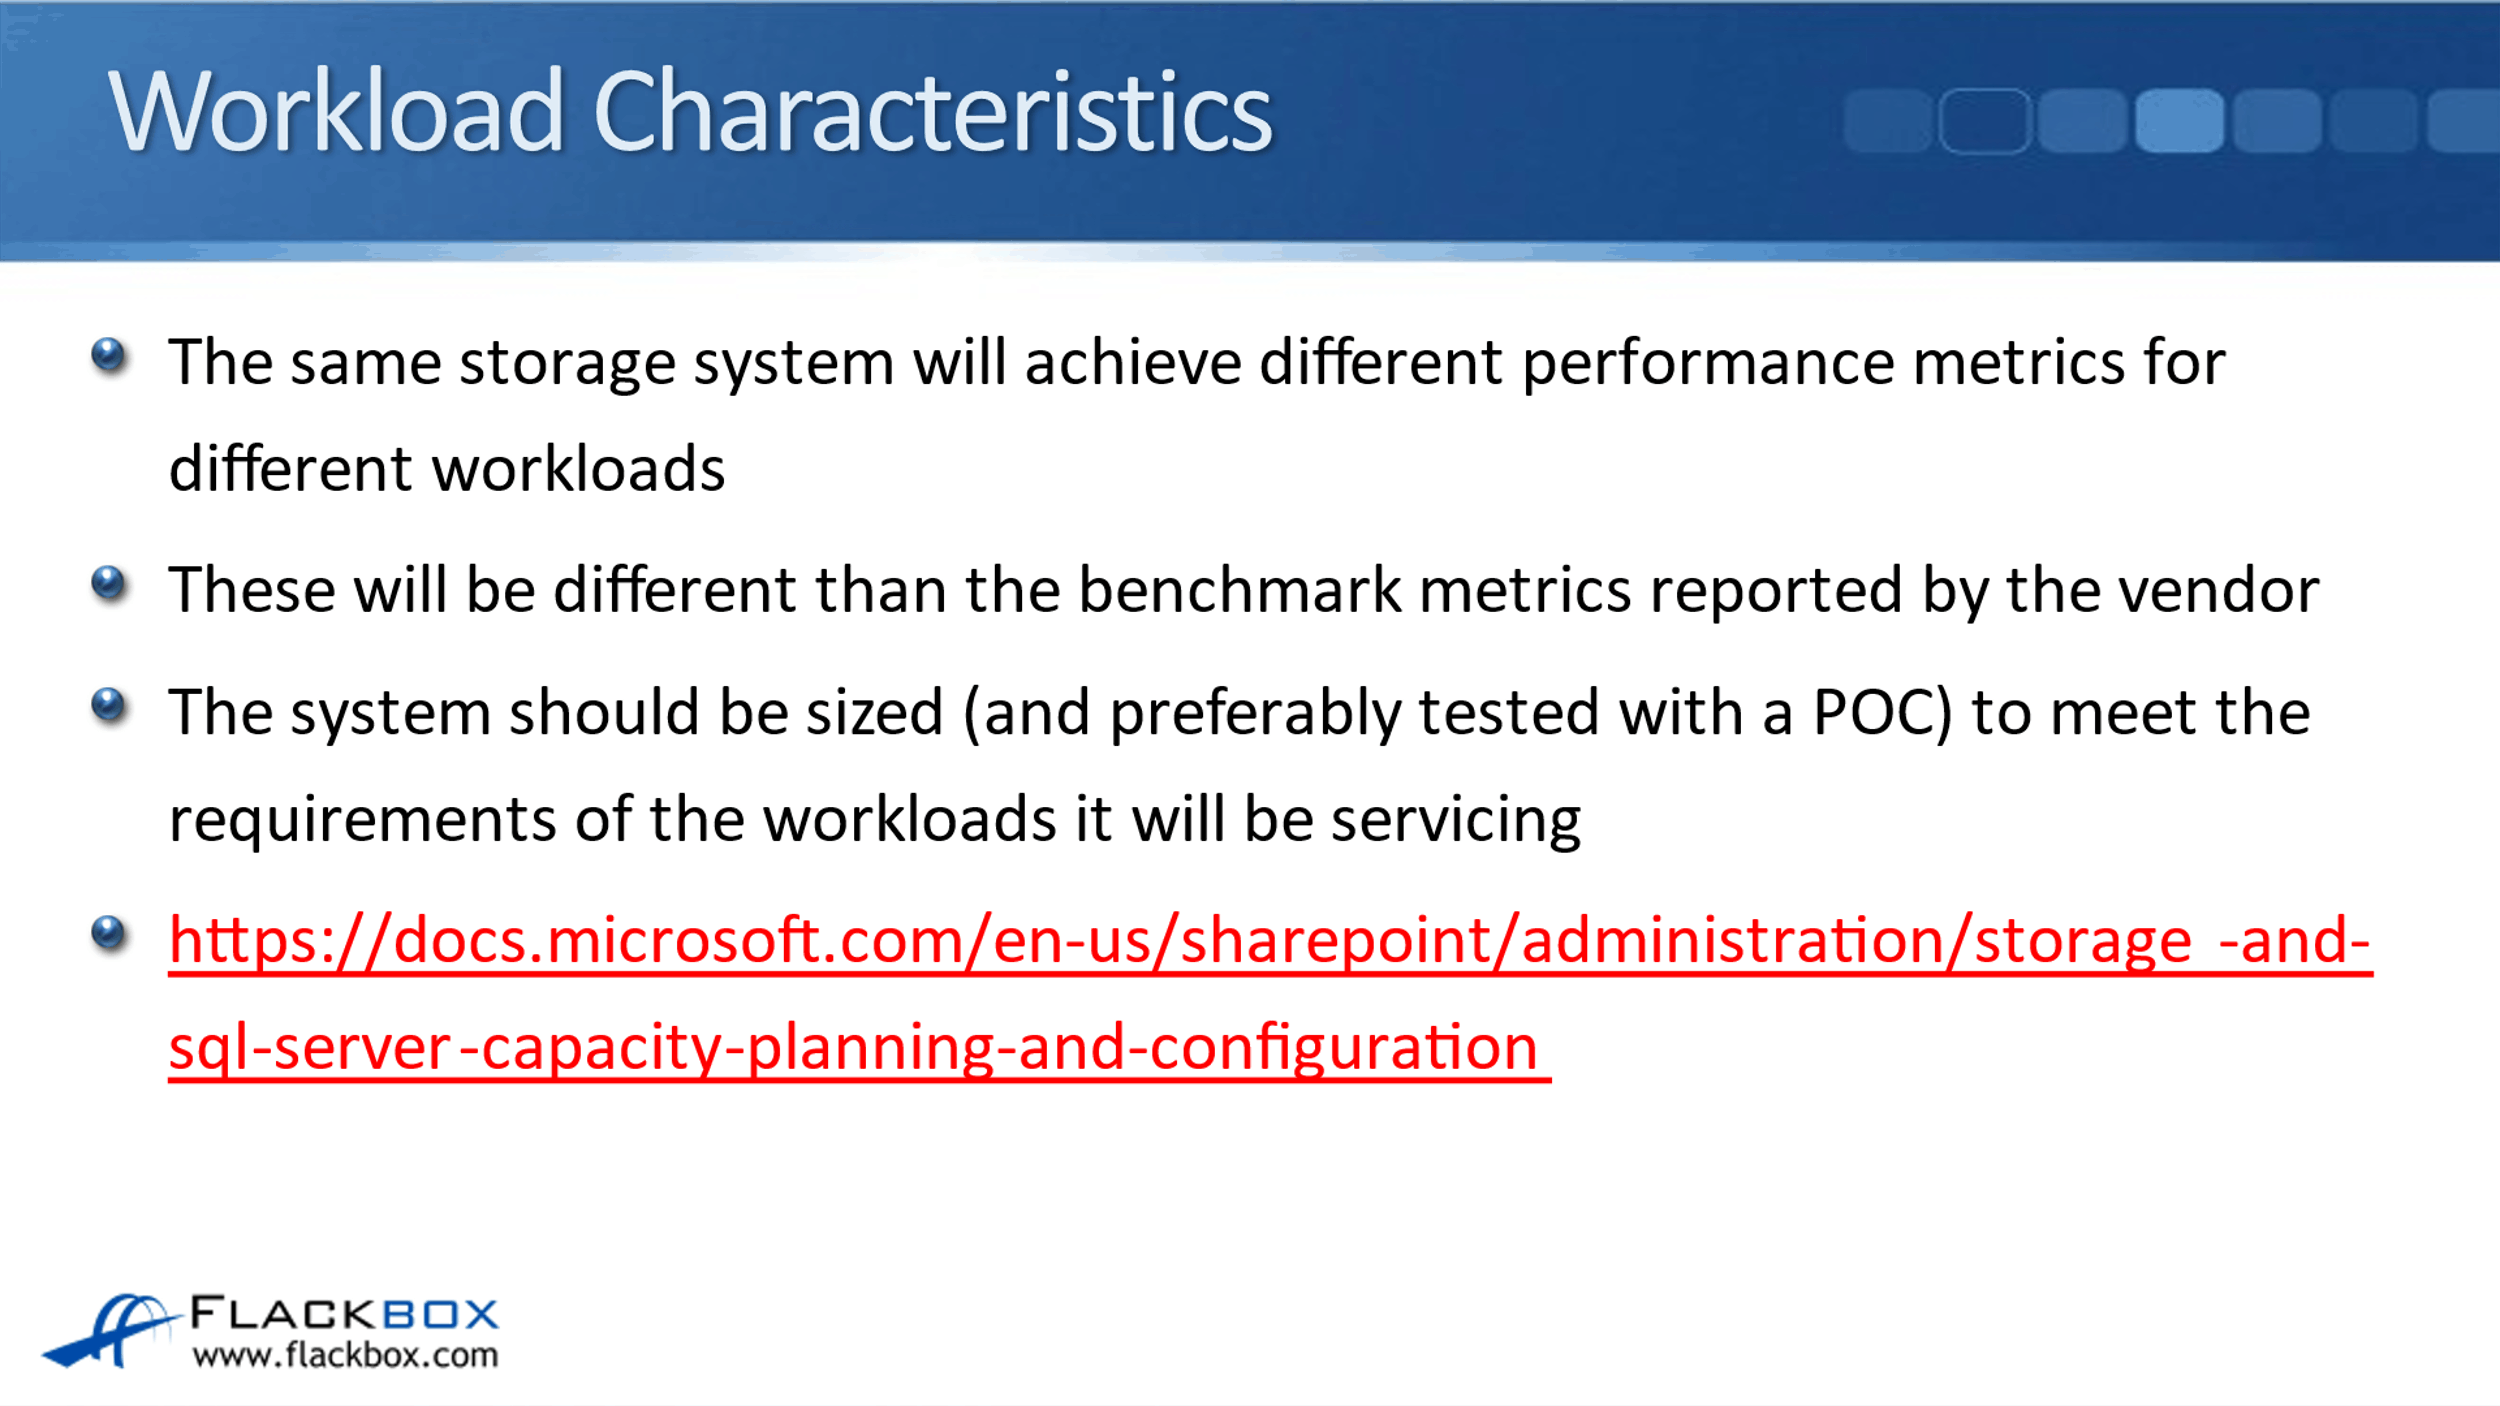
At the same storage, it's just an exactly the same hardware will achieve different performance metrics for different workloads. These will be different than the benchmark metrics reported by the vendor. When a vendor comes out with a new storage system, they will release figures about the achievable IOPS, Throughput, and Latency.
All vendors will make the storage system look as good as possible. Therefore, they will do that using a workload that is really going to highlight the performance of their system.
For your actual workload that you're going to be using in your real-world environment, you can't really expect to get those same performance results unless you're using a workload that has got exactly the same characteristics.
So, when you are going to be provisioning a storage system, you should size it and also preferably test it beforehand with a proof of concept to meet the requirements of a workload or workloads that it is going to be servicing.
Commonly Used Performance Measuring Tools
There are some commonly used performance measuring tools from NetApp. You can use the Command Line Interface (CLI). The main command that you will use at the command line is the statistics command.
You can also use the System Manager as well. You’ll soon learn that on a lot of pages, such as the volumes page, it does report those performance metrics right there in the GUI.
You can also use Active IQ. By default, your storage system is going to be sending information to NetApp on a weekly basis, including performance reports and you can view those reports via Active IQ.
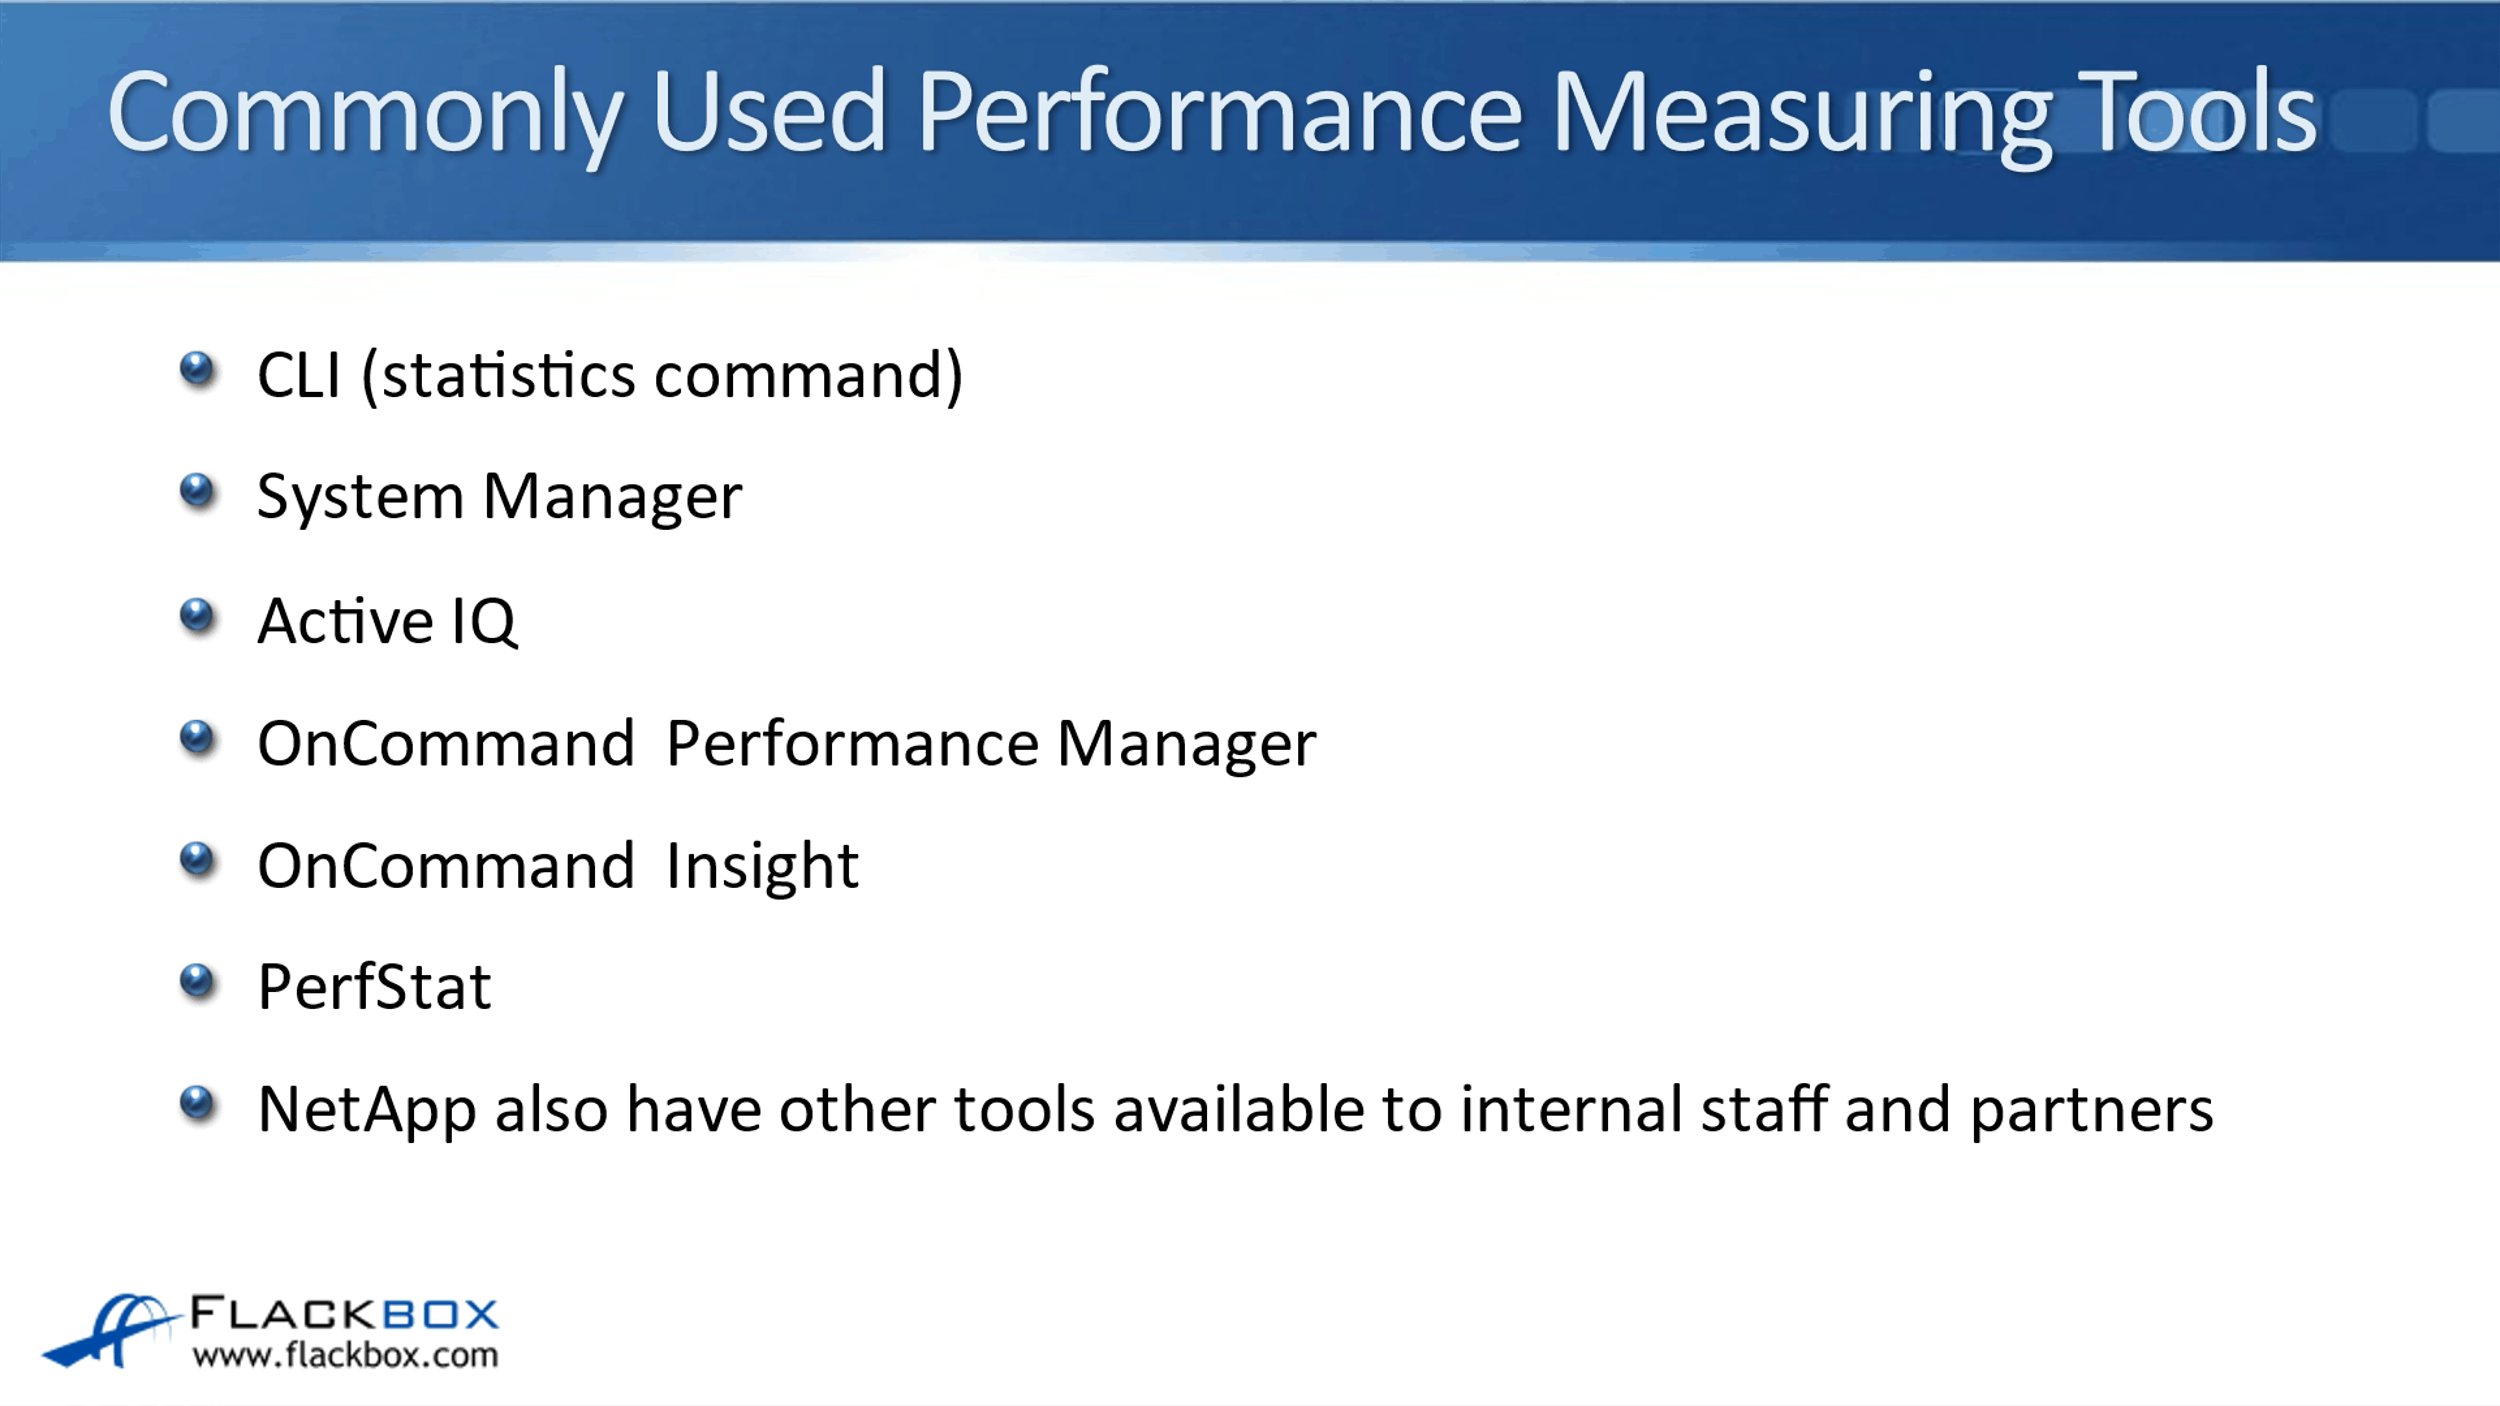
To get a more detailed analysis, you can use OnCommand Performance Manager, which is a part of the OnCommand Unified Manager Suite. As well as just giving you the roll metrics, you can also do things in performance manager such as setting thresholds and getting an alert if the system goes over that threshold.
Performance manager is used in a purely Netapp environment. If you've got heterogeneous storage environments or storage systems from different vendors, and you want to be able to monitor them all from a single pane of glass, you can use OnCommand Insight for that. OnCommand Insight also has performance reports.
Another tool is PrefStat. This is a tool that you run on your system that will gather lots of information, including performance details. NetApp also has other tools available just to the internal staff and partners. Because those tools are available if you are working with NetApp or one of their partners, they will be able to do a more detailed analysis of performance for you.
Utilization and Headroom
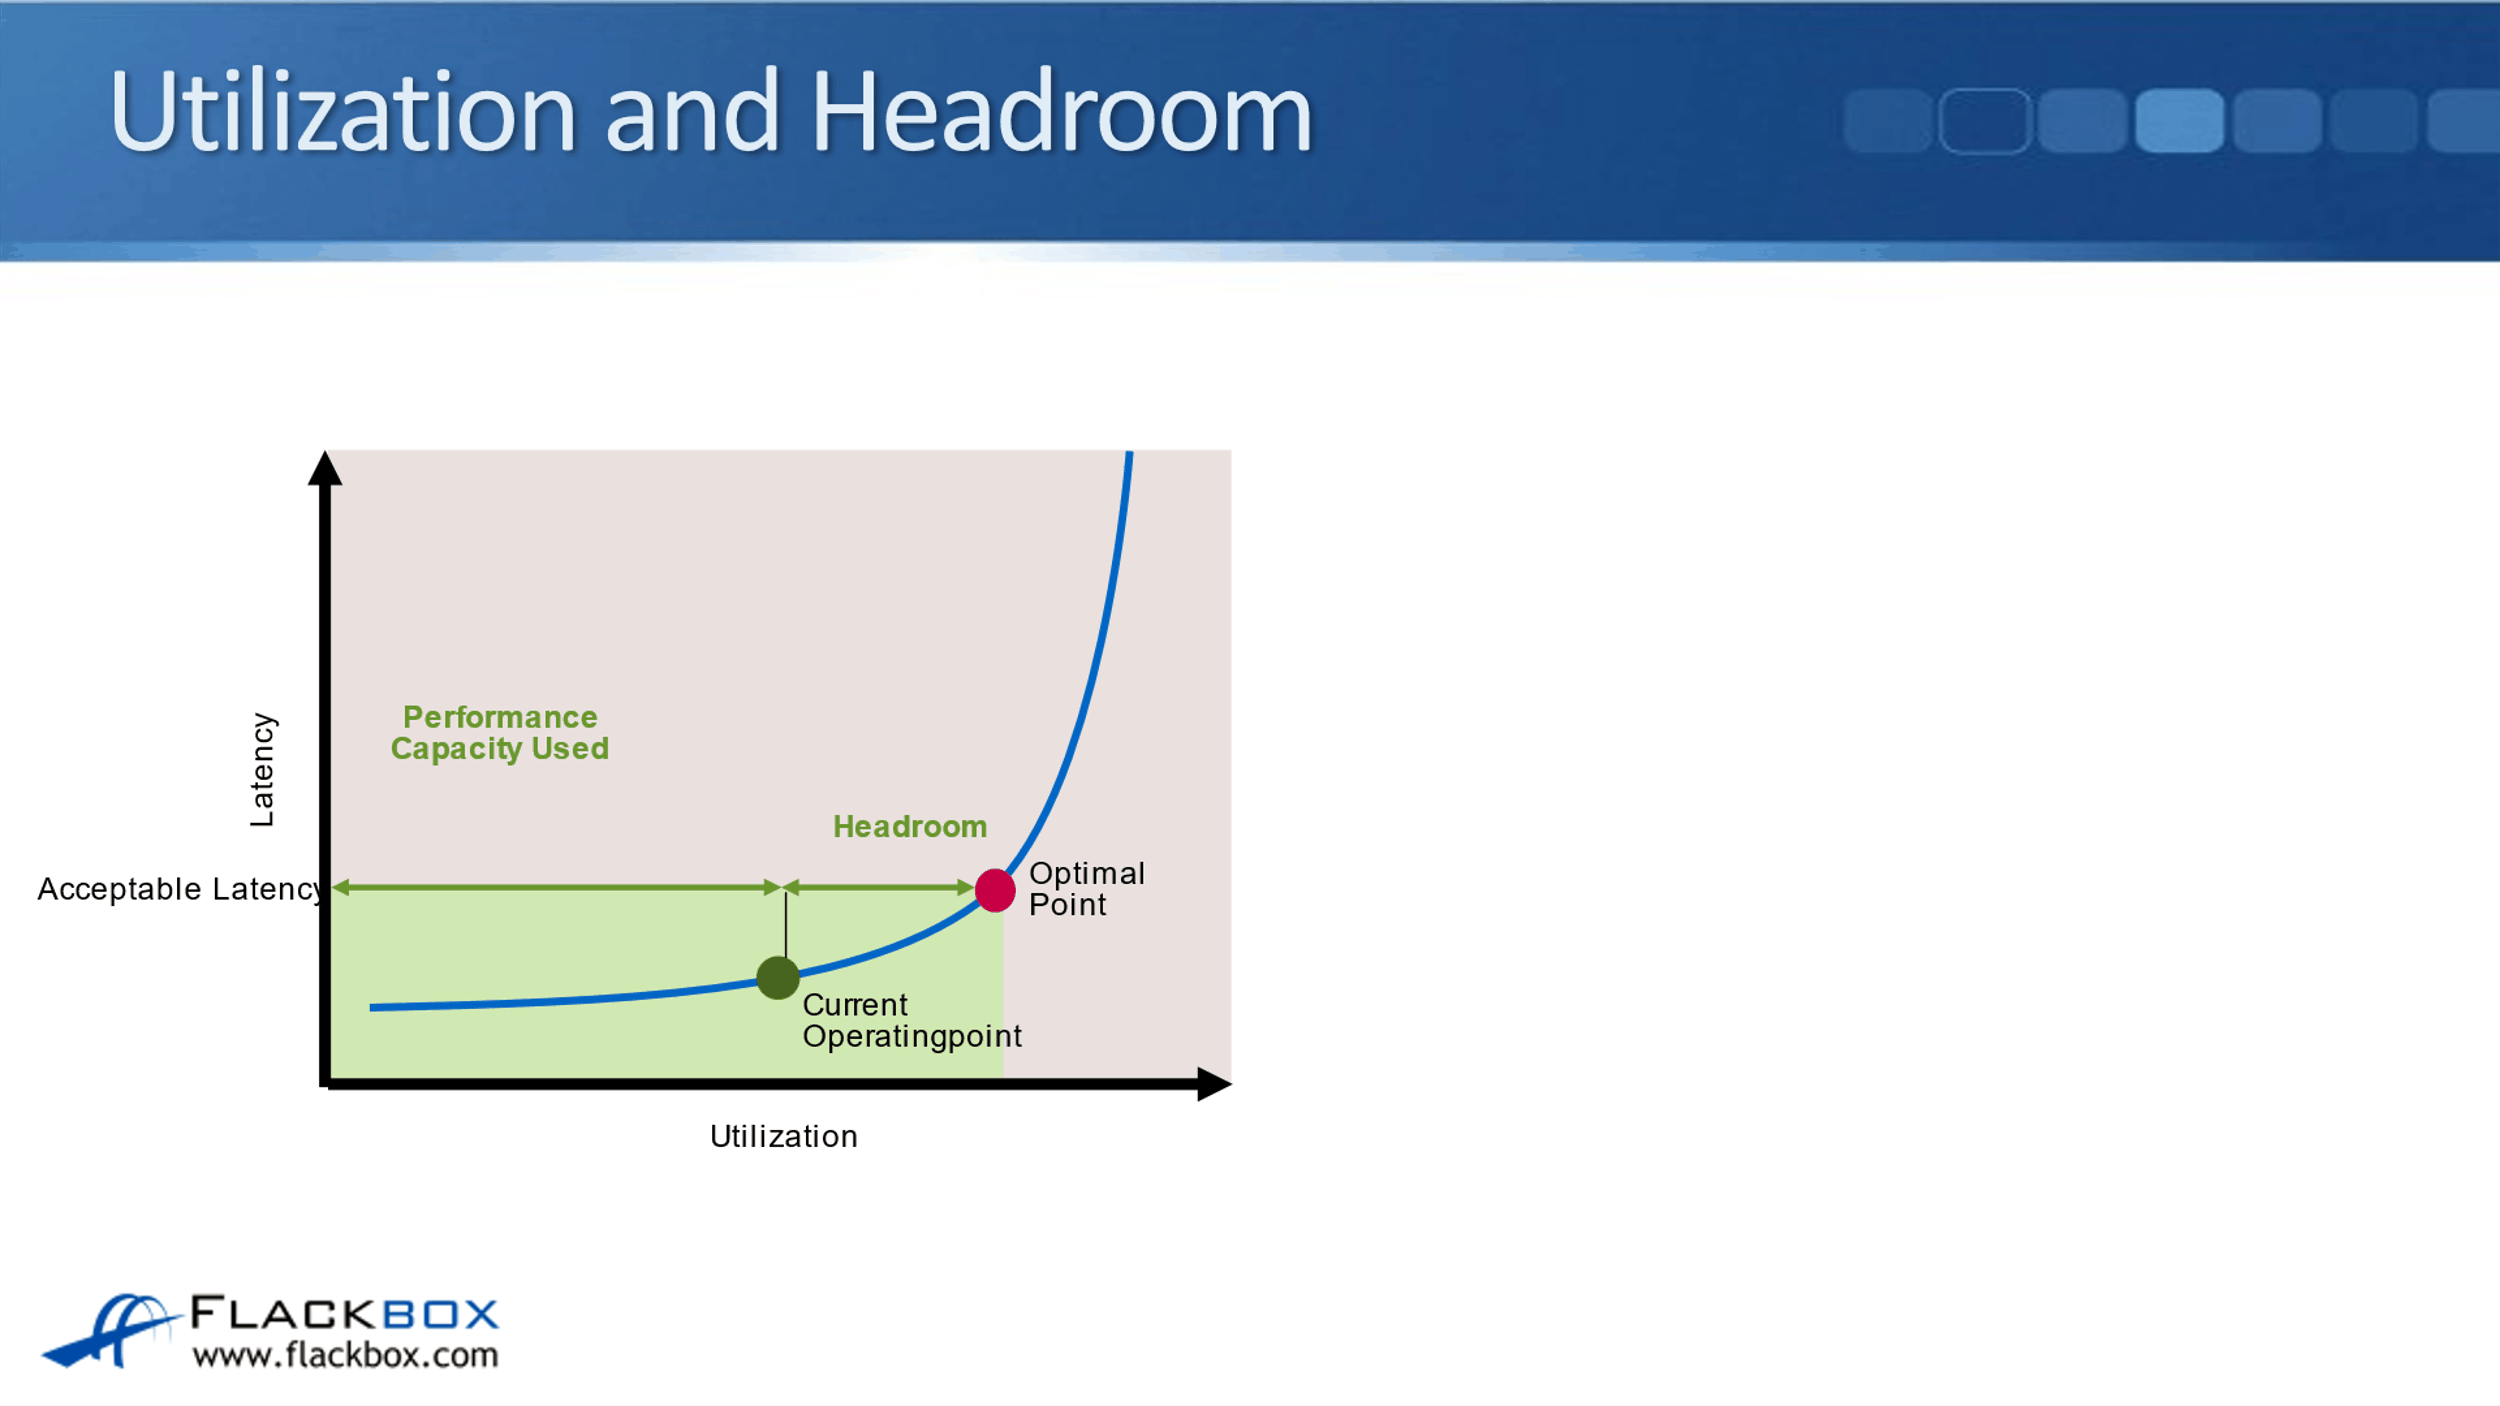
The next thing to talk about is utilization and headroom. For example, in this particular workload below, you can see the acceptable Latency amount. This is on an example live system. The workload is running here and we can see the amount of work that is currently being through at the storage system. You can see the current operating point on the graph and the higher up is the optimal point.

In this example, the workload could actually send more work to the on the top system and it would still be able to handle it within that acceptable latency period. But you'll see the amount of work that the system is doing goes up. It's going to reach an optimal point.
The optimal point is where the system is doing as much work as possible within the acceptable latency period. If you started sending more work to the system beyond the optimal point, then performance is going to degrade and the Latency will not be acceptable.
While we're looking at this, you're maybe thinking, “How do I know what is the acceptable latency for a particular application?” Also, other questions you need to ask about the workload are “How much storage space is it going to require?” and “What performance does it require, not just in Latency also the Throughput and the IOPS as well?”
Luckily, you'll find it for most major applications and workloads that the actual vendor is going to provide you with that information.
For example, let’s go to the Microsoft website and look for the page that gives you information about the required storage if you're running a SharePoint server with a SQL database. Let's just scroll down a little bit and go to estimate core storage and IOPS needs. If I go down a little bit further here, you see it gives you information and it helps you estimate how much storage space is going to be required.
It gives you a formula that takes into account how many documents you expect to have and what the average size of those documents is going to be. You can use the formula to estimate the actual amount of space that is going to be required. You also need to know what the required performance is as well.
When you are going to be deploying a workload on on-top storage, typically you will be able to find this kind of information from the vendor.
Ways to Improve Performance
Back to the example, let's just imagine that this example workload is a SQL database for SharePoint. We can see the current operating point and the optimal point here. If you are using performance manager, we will get reports on the headroom that is available.
Let’s say the company hires a lot of extra users who are using that SharePoint server. We start throwing more work at the storage system, and we see that we're going to reach and then go past the optimal point.
For that situation, we would need to improve the performance that was available for that particular workload. If you do look in performance manager, it will give you suggestions in there for the best way to do that.
First up is ONTAP has a scale-out architecture. You can add controllers, disks, and shelves to improve the overall performance that is available on the cluster. Other hardware you can add are the caching technologies, FlashCache and Flash Pool.
You can add SSD Drives so you can use SSD Drives, rather than spinning disks, as they've got better performance. You can add disks to an aggregate as well. When an aggregate is doing work, that work is spread across all the disks that make up for aggregate.
If you add more disks, that gives you more possible performance. You'll see that sometimes for some workloads it's advised to make the aggregate bigger than is required for the actual amount of data that is required to be stored. The reason for doing that is to get those additional spindles for better performance.
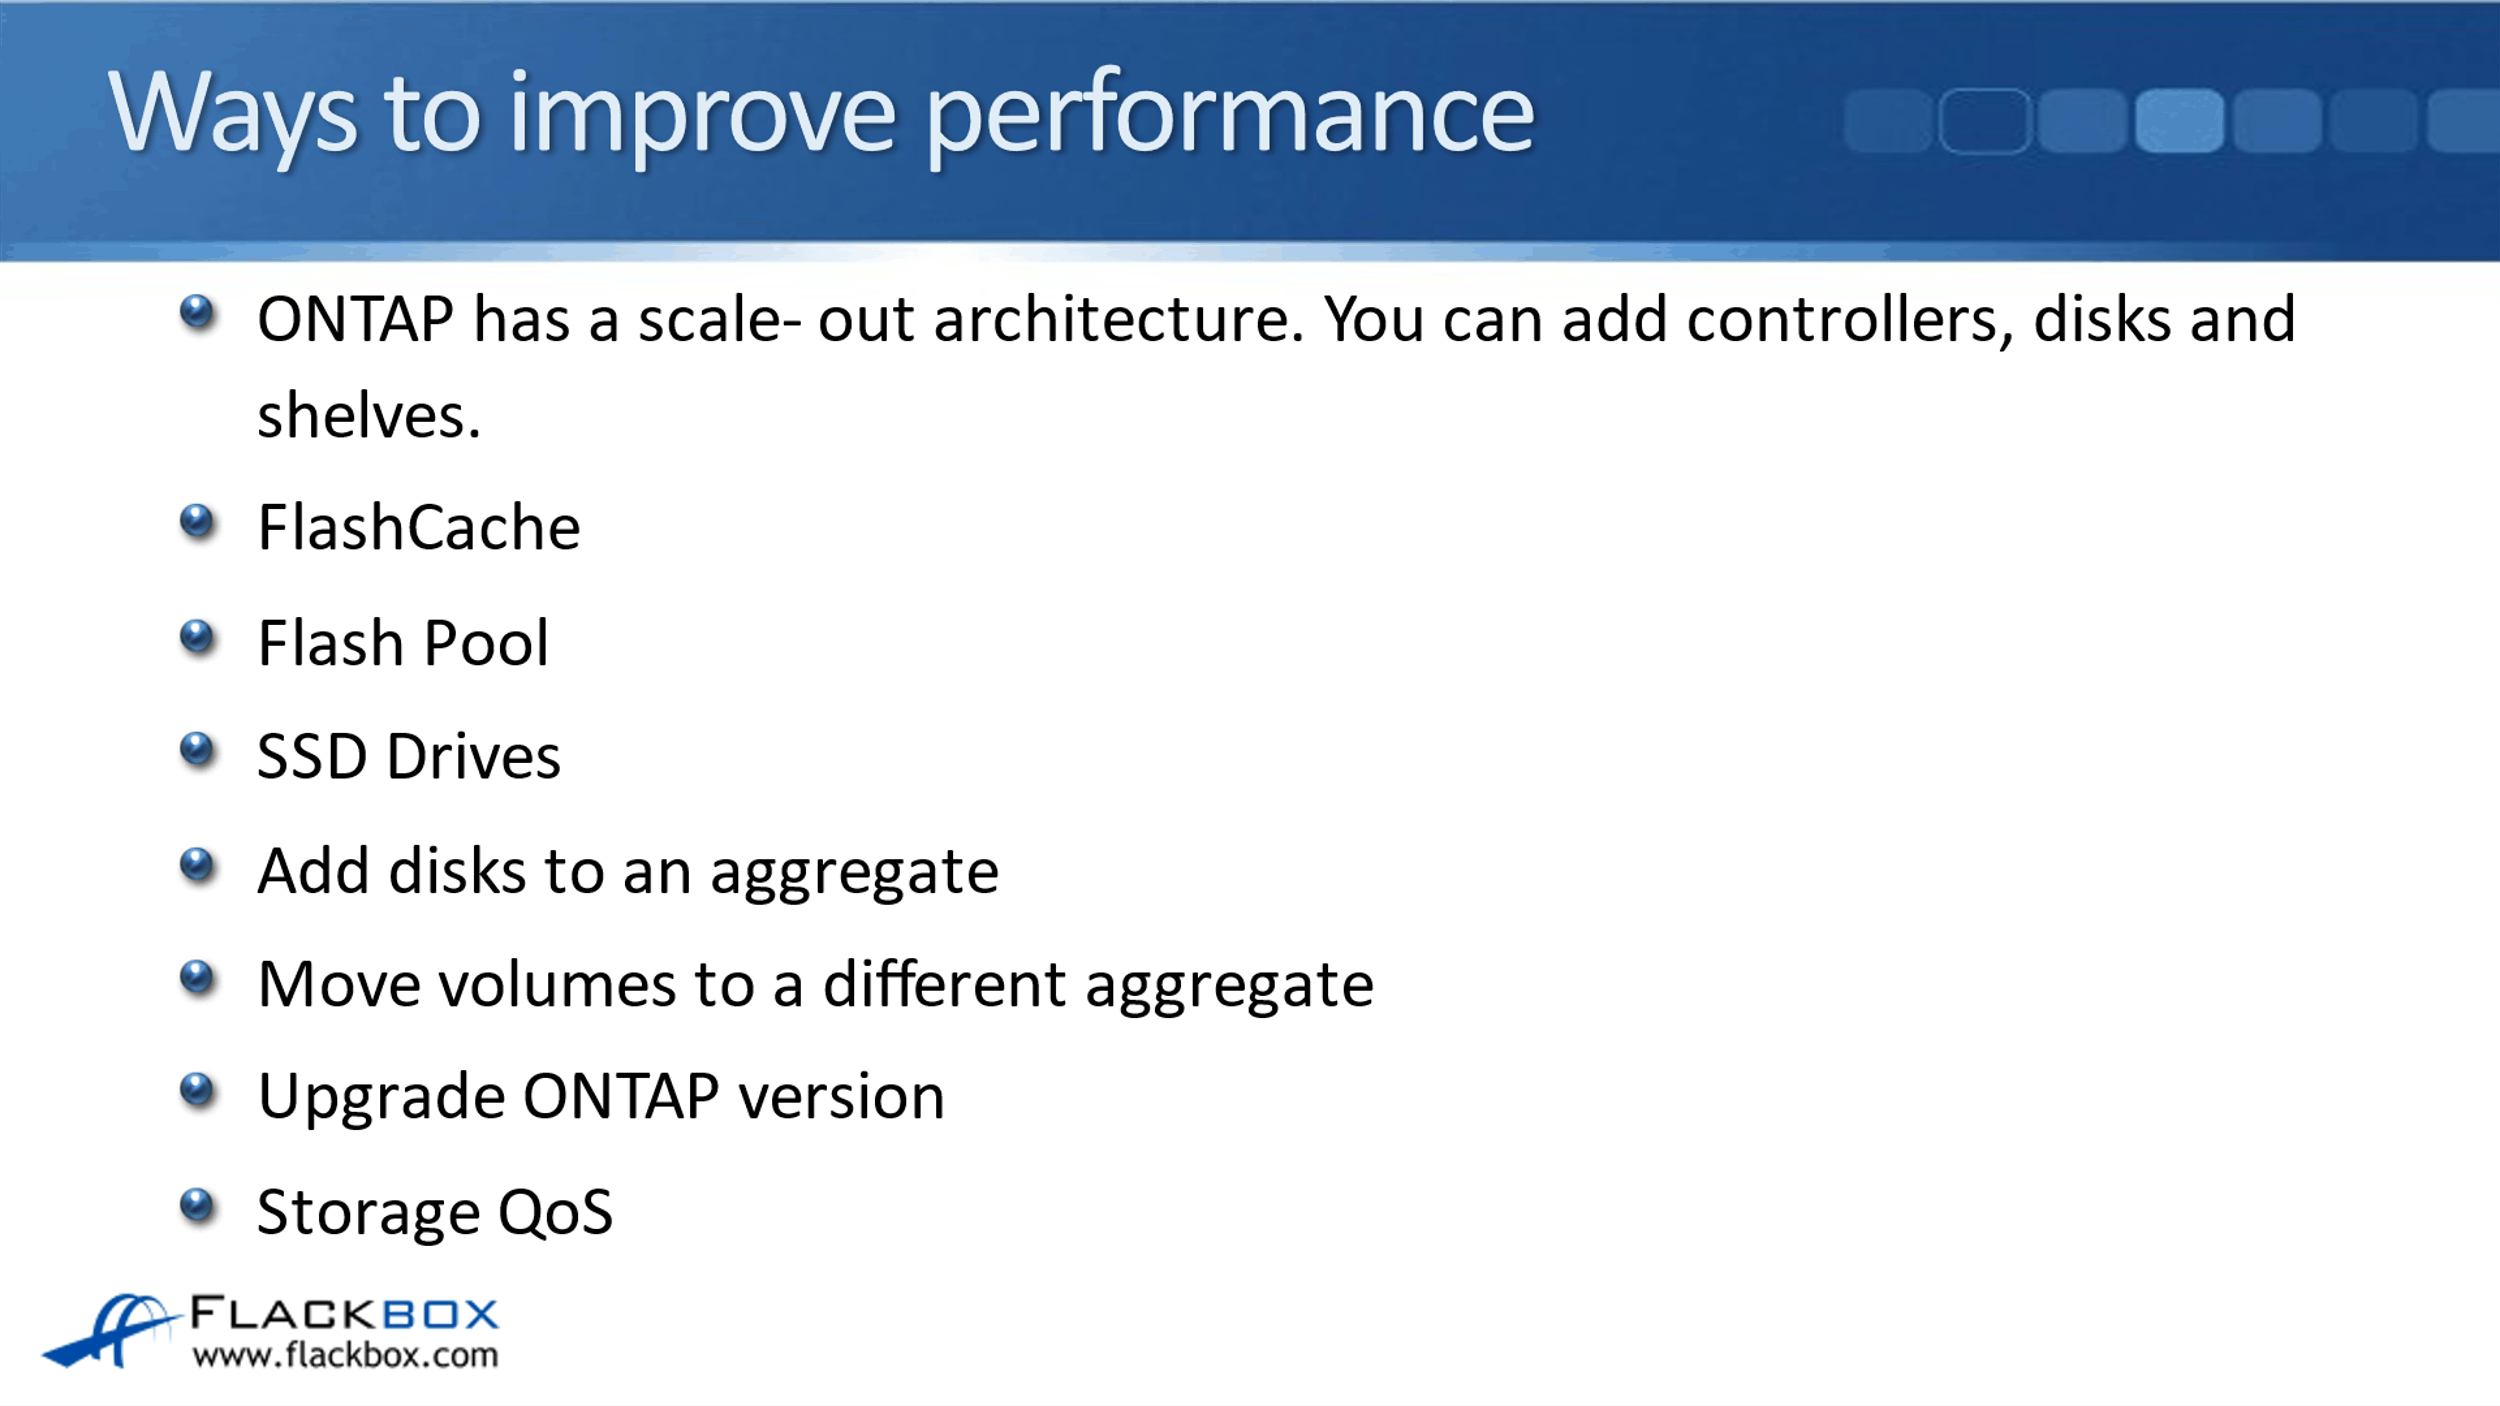
If you find that you've got an aggregate that has got multiple volumes on there and has no enough performance available for all those different volumes, you can move the volumes off to a different aggregate or in a different node.
You can also upgrade the ONTAP version every time that a new version of the existing ONTAP upgrade comes out. NetApp has made further optimizations to improve the performance so, you will normally see a performance boost when you upgrade ONTAP.
The last thing that we can do is we can configure Storage QoS. With this, moving volumes to a different aggregate is going to improve the performance for that particular workload in the aggregate. Also, storage QoS is used to improve the performance of a particular workload.
All the other things that you see here, which are done at the hardware level, there are going to typically improve the performance overall on the cluster. Upgrading ONTAP will do that as well.
‘Ballpark’ Latency Metrics
One last thing I want to show you here is the ‘Ballpark’ Latency Metrics for the different types of disks that you can use. In this example, we have got a client that is on the same local area network as the NetApp storage system.
The Latency from the client to the storage system is going to be a roundabout one millisecond. This is for read requests. If the read is served from system memory that is fastest it's going to be up to about 0.1 milliseconds. If it is served from FlashCache, that will be up to about 1 millisecond, the same for an SSD aggregate as well, because we're using the same type of technology.
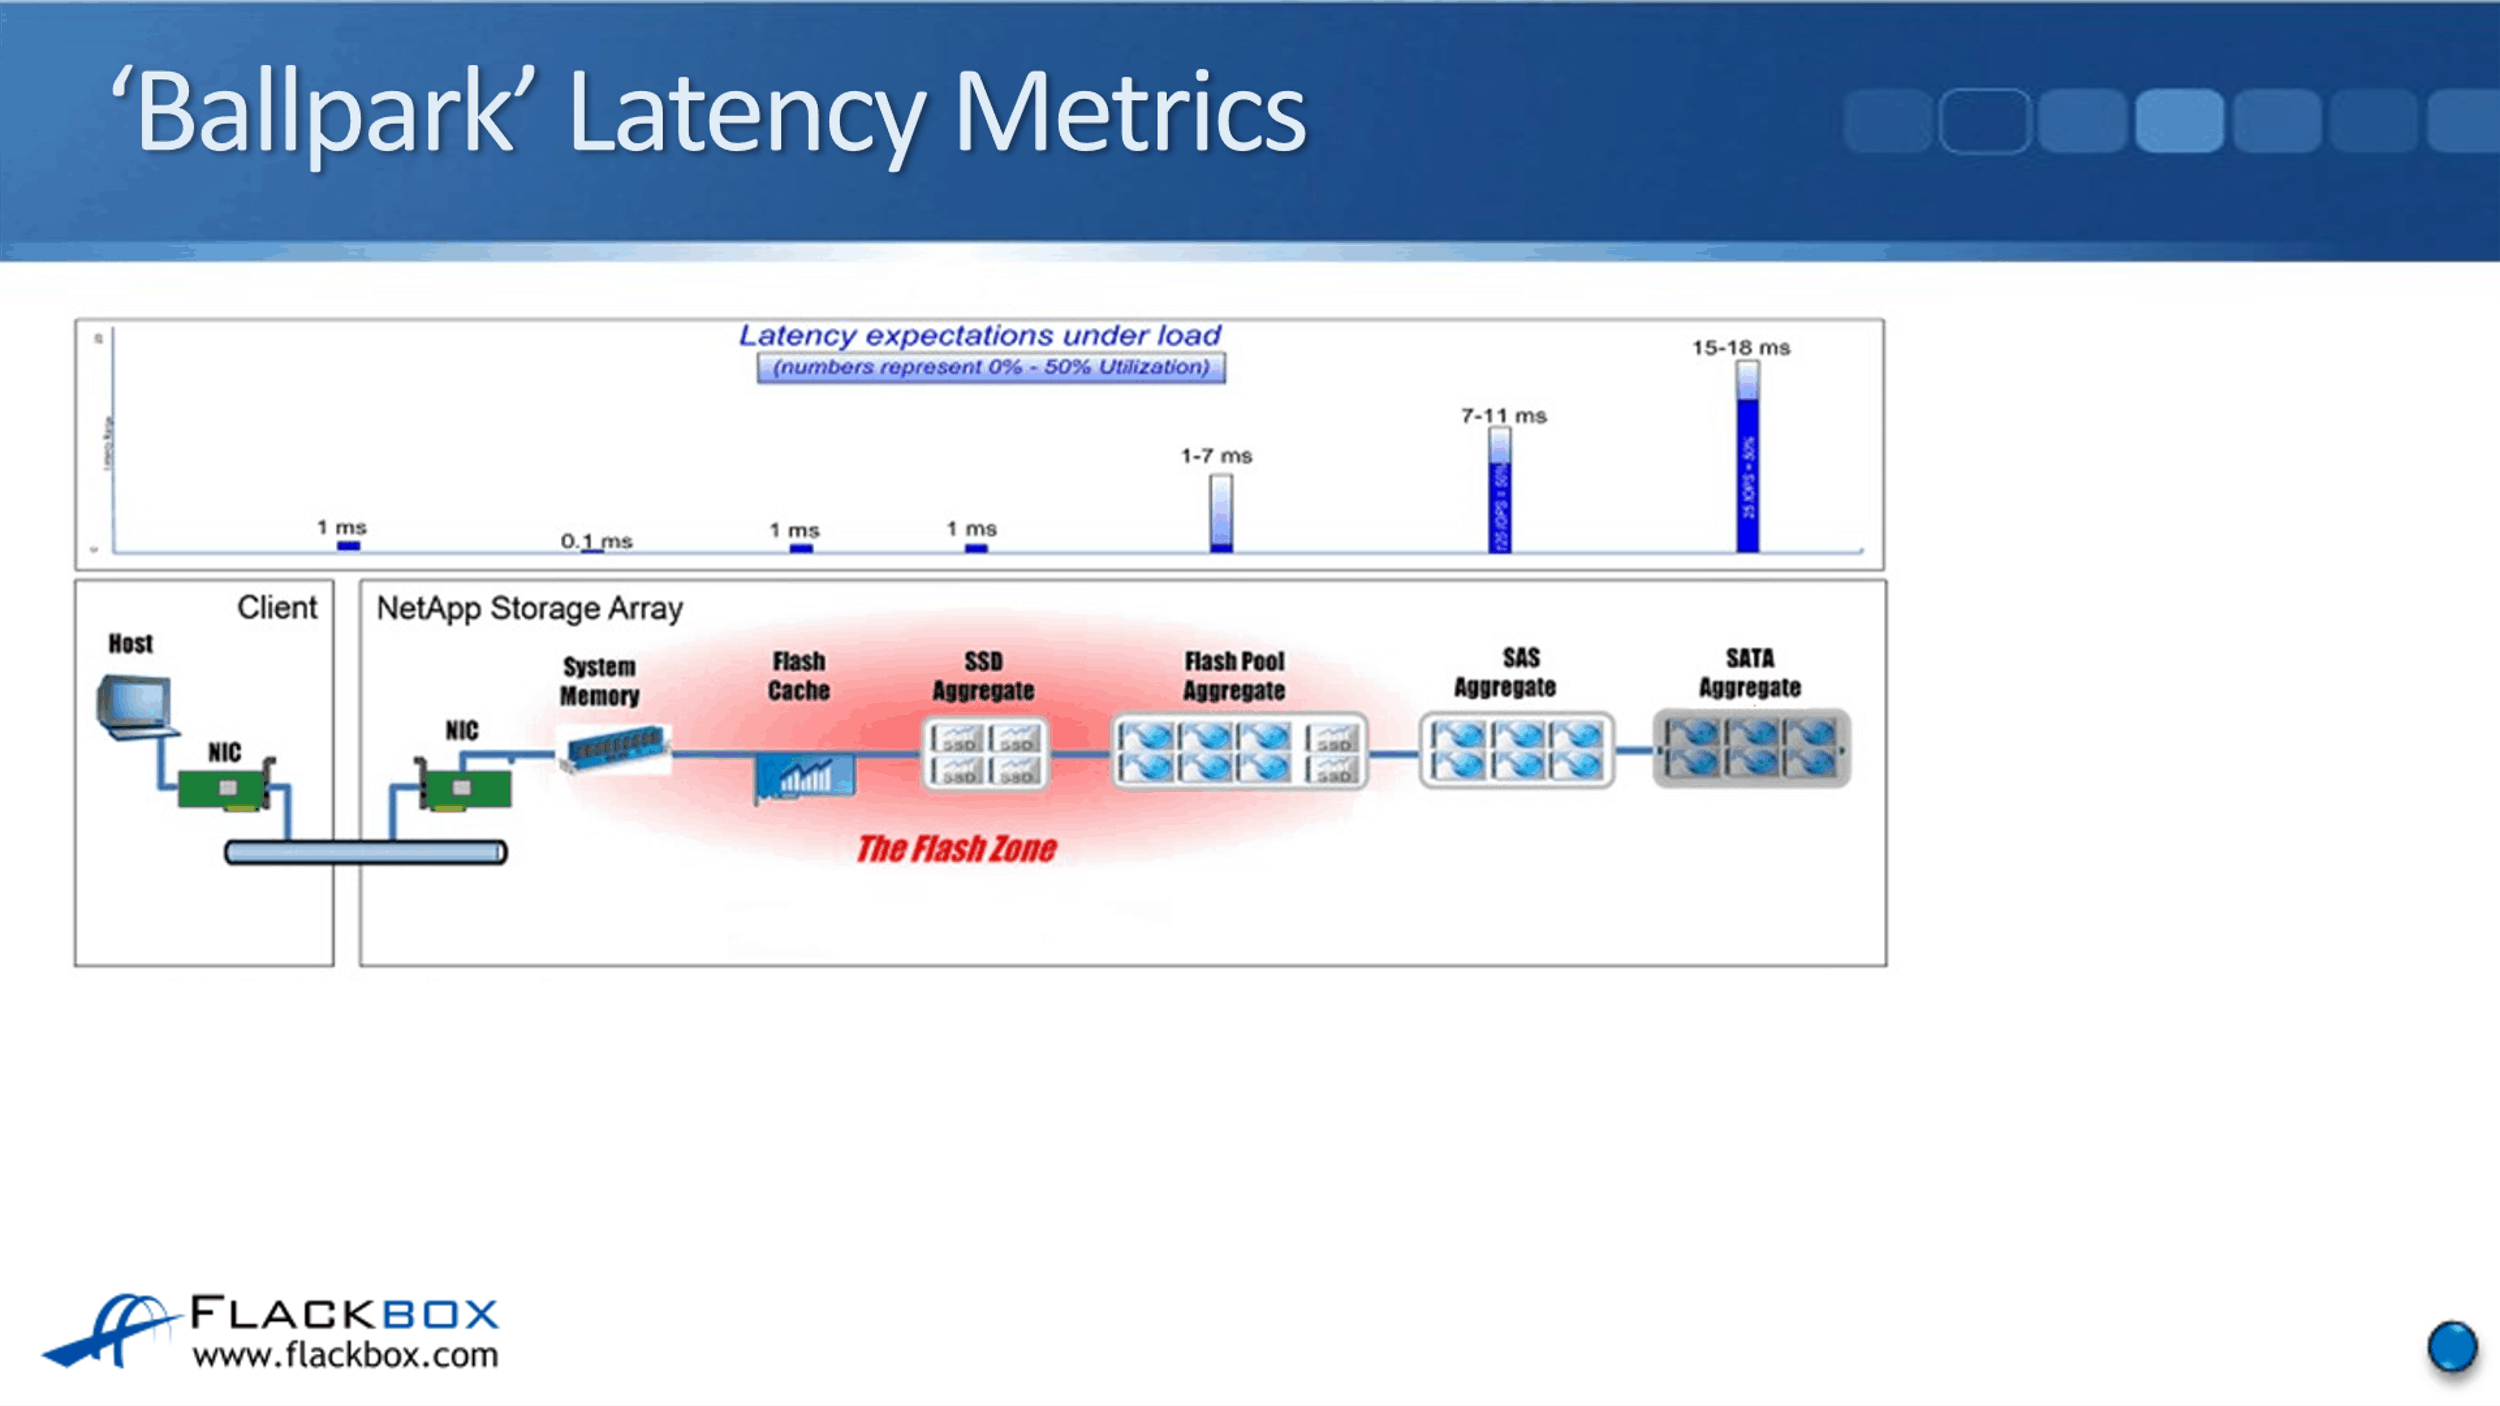
If the read is served from a Flash Pool aggregate, then that will be from one to 7 milliseconds. The big gap there is because if it's served from the SSD cache, it will be up to about 1 millisecond. If it's served from a SAS aggregate, the actual spinning disks, it will be up to about 7 milliseconds.
If the read is served from a SAS aggregate, you're looking at around up to 11 milliseconds. If it's SATA, it would be up to 15 or 18 milliseconds. You can see there that the actual hardware the read is served from is going to have a big effect on the Latency.
Additional Resources
Performance Metrics for Storage Resources: https://docs.netapp.com/us-en/ontap-automation/rest/performance_metrics.html
Monitoring Performance: https://library.netapp.com/ecmdocs/ECMP1653272/html/GUID-EDC4DAA3-E473-4DC9-9597-DDE36149F7B0.html
Ways to Improve Your Storage System's Performance: https://library.netapp.com/ecmdocs/ECMP1155586/html/GUID-62D0E154-7809-45FA-B5D4-6D67899CAE99.html
Libby Teofilo

Text by Libby Teofilo, Technical Writer at www.flackbox.com
Libby’s passion for technology drives her to constantly learn and share her insights. When she’s not immersed in the tech world, she’s either lost in a good book with a cup of coffee or out exploring on her next adventure. Always curious, always inspired.