In this Cisco CCNA tutorial, you’ll learn about Syslog on Cisco devices. Syslog is a standard format for logging messages and Cisco iOS complies with that standard. Scroll down for the video and also test tutorial.
Cisco Syslog Video Tutorial

Mahmud Hasan

This is one of the best online courses I have ever participated in. The step by step lab set up guide, detail and easy to understand presentation and prompt response from the instructor are some of the key points that I like most about the course. I finished the course and cracked the exam. I do recommend you all to take this course for CCNA exam preparation.
A Syslog message is generated when something happens on the device, like if an interface comes up or goes down, or if an OSPF neighbor adjacency comes up or goes down.

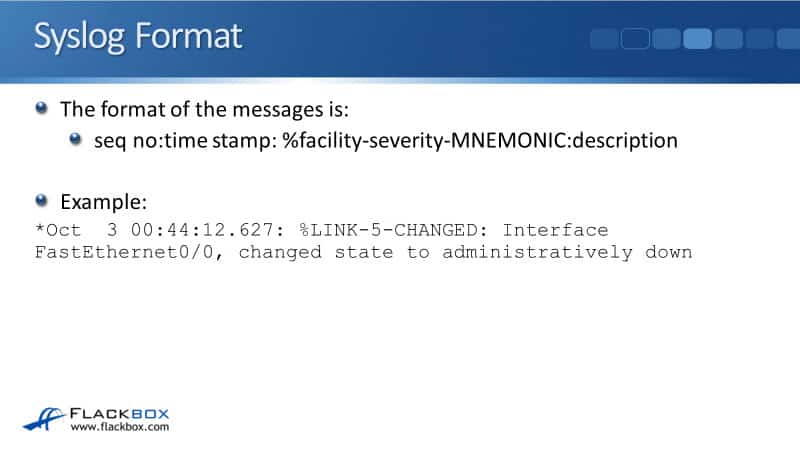
Syslog Format
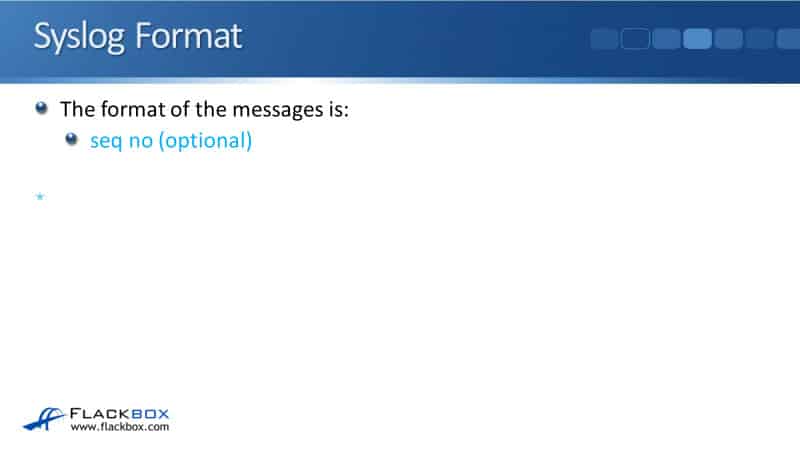
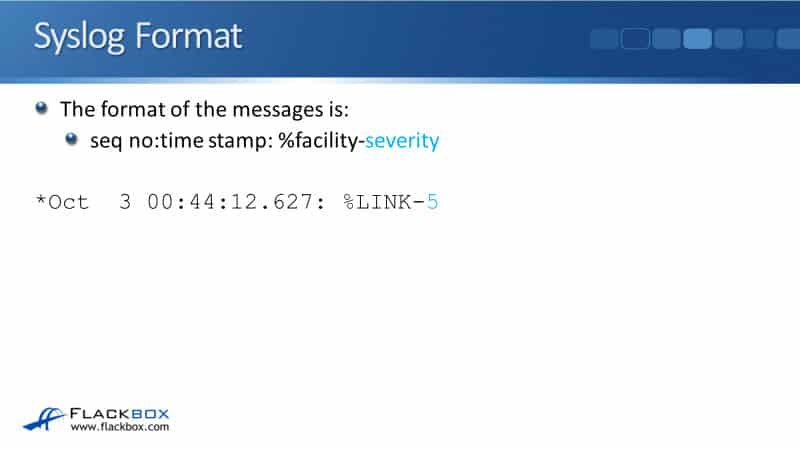
There's a set format for the Syslog messages and this is an industry-standard. All vendors comply with this standard. There are quite a few parameters here, so let's go through it one by one.
The first thing in the Syslog message is an optional sequence number. In our example, we don't have one set, so it's just a star there.
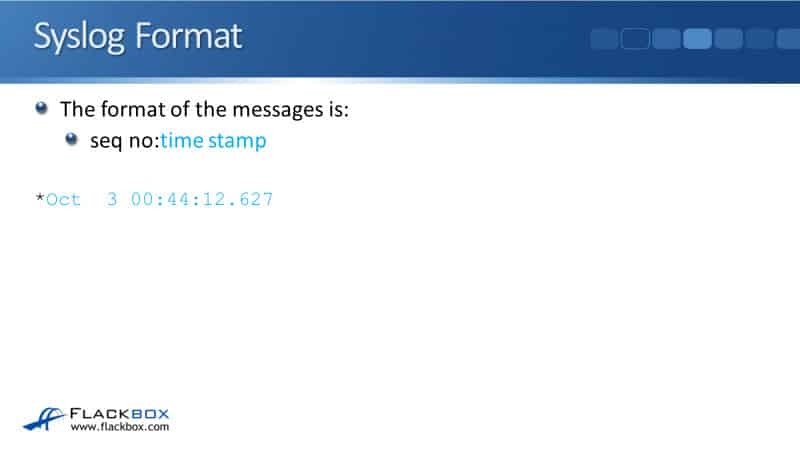
The next thing in the message is a timestamp. You can see from our example that this event happened in October the third at about quarter to 1 AM.
The next thing that is enlisted is the facility. This is the thing that generated the event. In our example, it's going to be a change of state on a link. The facility here is the link. If it had been an OSPF adjacency coming up or going, then the facility would have been OSPF.

Next is the severity level. There are eight different severity levels going from 0 through to 7, with 0 being the most severe. In our example, the severity level of this event is severity 5.
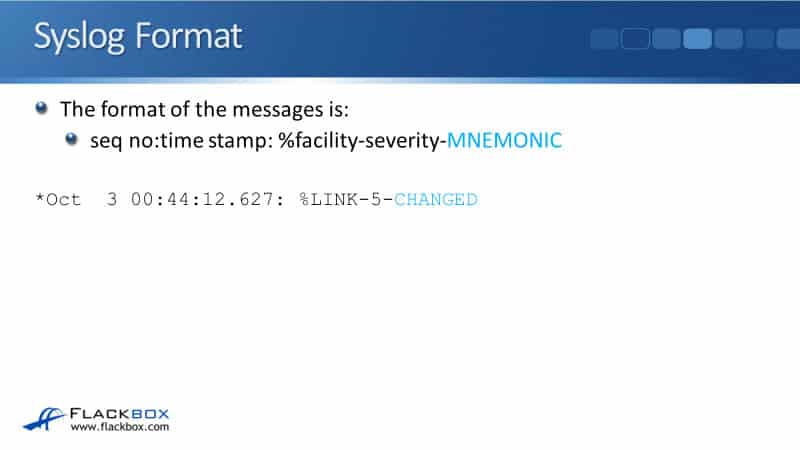
Next is a mnemonic, which is a short description of what happened. Here we can see that a link has changed.
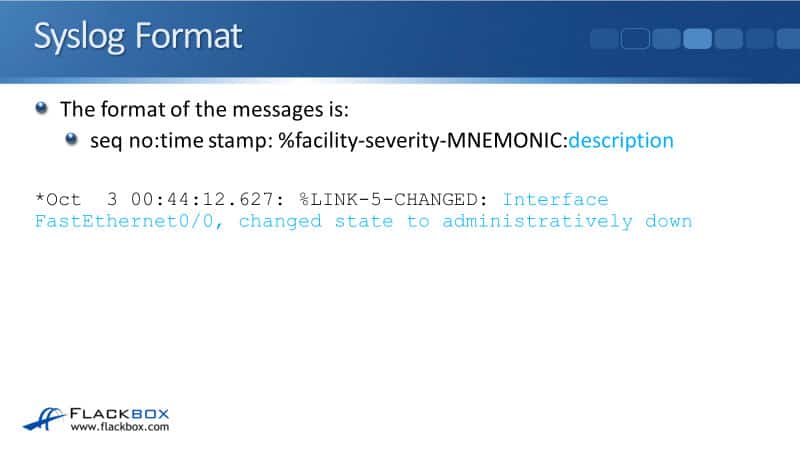
Finally, the last thing in the Syslog message is a more detailed description. You can see that the description in our example is “Interface FastEthernet 0/0, changed its state to administratively down.” So, somebody typed shut down on that interface.
Syslog Severity Levels
There are eight different syslog severity levels, from 0 through to 7 and with 0 being the most serious. Again, these are standard levels that are used the same by all vendors and it's covered in the documentation for Syslog.
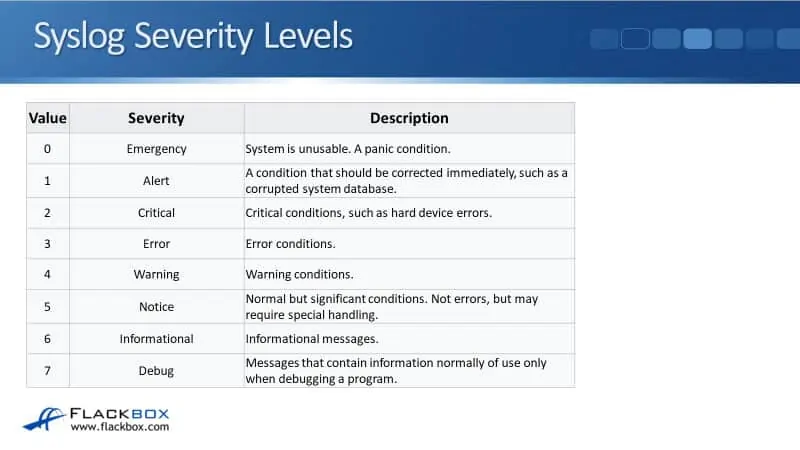
The most serious event you can have would be an emergency, which is value 0. The values go from zero to seven and each of those values has got a standard name as well. The name for severity level zero is emergency and that means that the system is unusable, a panic condition, it's really bad.
The next severity level is an alert, which is level 1. A condition should be corrected immediately, such as a corrupted system database. That's still really bad. Critical is level 2, such as hard device errors and level three is an error.
Levels 0 to 3 are bad errors happening on your device. Level 4 is a warning. So that might be serious, it's definitely something that you want to check out.
Level 5 is a notice, which is a normal but significant condition that you should also check. For example, an interface is shut down by an administrator. That's not a warning or an error because somebody has to have deliberately done that, but obviously, that can be impactful on the device. That's why it gets a notice level.
The next level, level 6 is informational. It is just an informational message. Nothing's wrong. It's a normal thing happening, but it's telling you about it. Lastly, level 7 is debug. These are messages that contain information, normally used only when debugging a program.
Logging Locations
Syslog messages can be logged to various locations from your router or switch. The first place that we can log to is the console line. If you are connected to the device over a console cable, you're logged in and you're working at the command line, then you'll see Syslog messages popping up in the command line interface as you're working in there.
The logging to the console is turned on by default and the default severity level is debugging (7). Everything gets logged to be console by default.
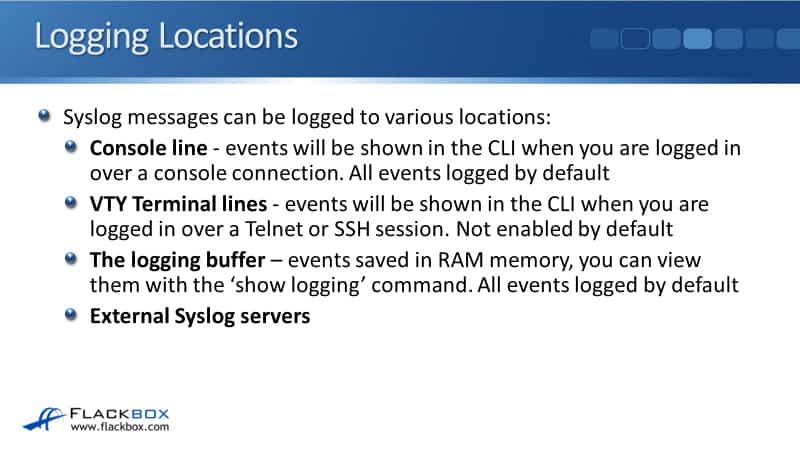
The next place that we can log to is the virtual terminal lines. This is for logging at the command line over a Telnet or an SSH session and it is not enabled by default.
You'll notice if you're working on a router or switch by default over a console connection, you're going to see messages popping up as you're working. But if you're over Telnet or SSH, you won't, that is because Syslog logging is enabled by default at the console, but not in your terminal lines.
The next place that we can log to is the logging buffer. This is where events are saved in RAM memory on the device. To view the buffer, you can use the show logging command. You'll see all via events that are in the buffer, and just like the console line, logging to the buffer is enabled by default as well.
The last place that we can log to is an external Syslog server. We’ll talk about in a bit more detail later on in this tutorial.

You can log to the logging locations as many of them as you want. It's the same messages that will be getting logged to each of the different locations, but you can log either the same or different severity levels to each of those different locations. When you do that, all messages of that severity level that you set for that location and higher will be logged there.
For example, if you set a logging level 3 for the console, then events with levels 0, 1, 2, and 3, will be logged there. It's everything about the level and everything more serious as well. Remember, the lower the number, the more serious it is. If you set a logging level of seven to an external Syslog server, events from all severity levels 0 to 7, will be logged there.
Internal Logging Locations Configuration
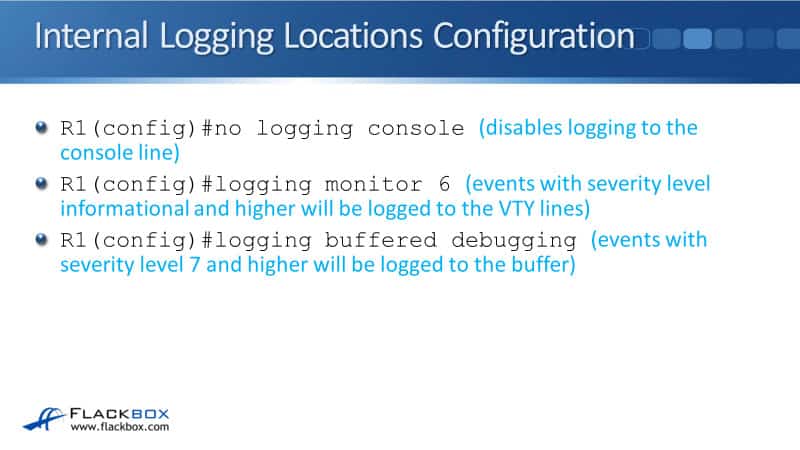
Let's have a look at how you would configure this. Remember logging the console is turned on by default. If you want it to disable that, then in the global config mode, you could use the command:
no logging console
The next example is for logging to the VTY lines for Telnet and SSH connections. We have the command:
logging monitor 6
6 is the level and it is known by the name of informational. Everything informational and higher would show up in your command line when you're logged in using a Telnet or SSH session.
The last example here is with the command:
logging buffered debugging
Buffered is going to the RAM buffer and here it is at the debugging level. That would be everything seven and higher.
Logging to an External Syslog Server
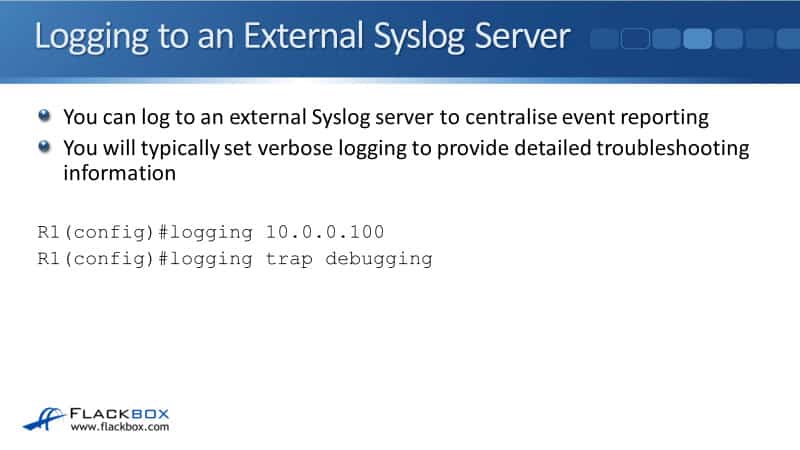
You can also log to an external Syslog server. The benefit you get from this is that it centralizes event reporting. Maybe you've got 30 routers and switches on your campus. You could configure them all to log to the same Syslog server and then you've got one single location that you can use for monitoring all of the logs.
If you are using an external Syslog server, you'll typically set verbose logging there because you want to have a lot of information on that system. The whole point of a system is for logging, so you're not going to have minimal information getting logged there. You're going to log everything. That way, when you are troubleshooting later, you're going to have all the details that you need.
You don't have to do that, but it's what people would normally do. The configuration to log to an external Syslog server is at global config mode, issue the following commands:
logging <IP address via external server>
logging trap <severity level>
In our example, we have the IP address 10.0.0.100 and we're using debugging, which is what would normally be done.
External Syslog Server
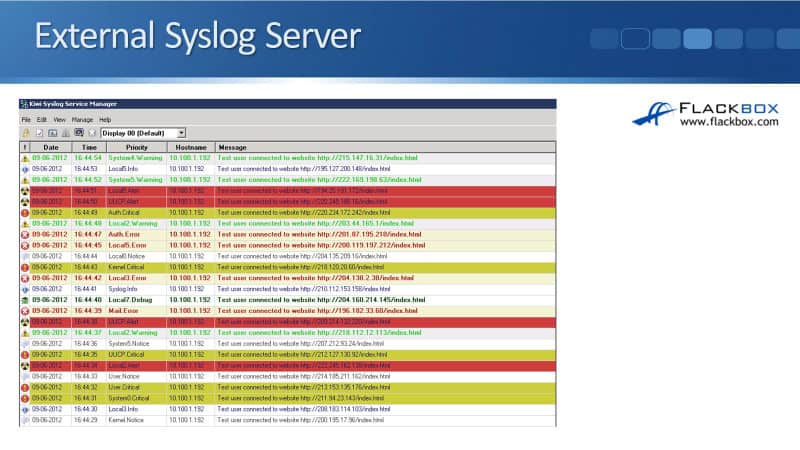
The example below is what you would see on that external Syslog server. The example here is the Kiwi Cisco server. There’s a free version that you can get and you can see the information that's listed there.
We've got the date of the event, the time the event happened, the priority which is the severity level, the hostname so you can see the actual device that logged this event, and then a message of what actually happened. This is really a basic Syslog server. It gives you the benefit of centralizing all of your logs.
SIEM Security Information and Event Management
Another thing you can use is a SIEM system. SIEM stands for Security Information and Event Management. This also provides a centralized location for all your logging messages, but this is normally a bit more of an expensive option than a basic search log server. It will typically provide advanced analysis, advanced reporting, nice graphs, and it can correlate events as well.
For example, if somebody was launching an attack against you, you would have multiple devices logging events about it properly. The SIEM system can move the information from those multiple devices and see that they're related to each other, and it can report on that for you. Using a SIEM system also gives you more advanced reporting tools and more advanced troubleshooting tools.
View Log Buffer and Configuration
Once we've got our logging set up, we can view how we have configured it by using the show logging command. In the example below, you can see that we are logging error severity level events to the console, warning to our VTY lines, and debugging to the buffer.
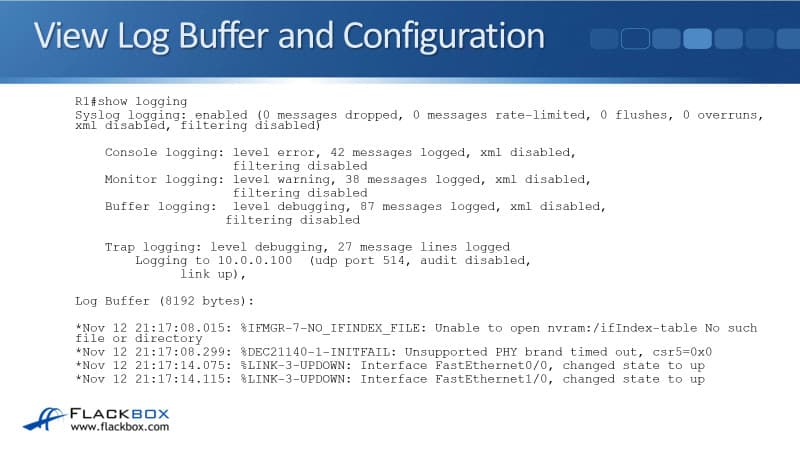
Also, underneath your configuration, you'll see all of the events that are in the buffer. You can see down at the bottom that there are couple of interfaces coming up. So that's how you see your configuration and also how you see the events that are in the buffer.
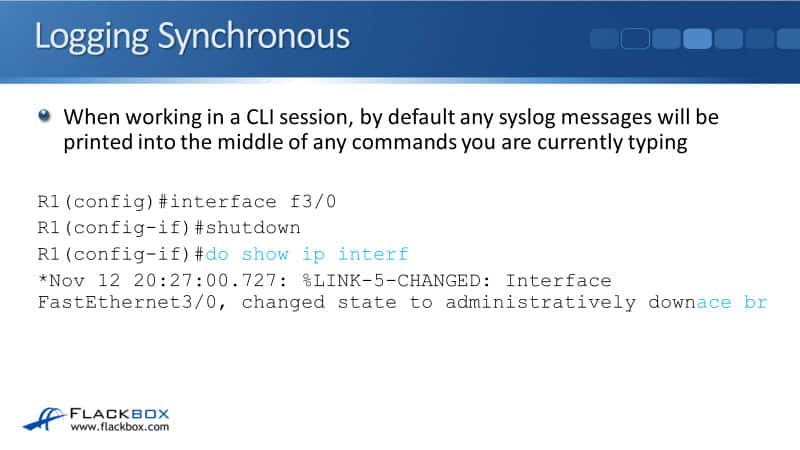
Logging Synchronous
When you're working in a command line session, by default, any Syslog messages that are getting logged there are going to be printed into the middle of any commands that you're currently typing. You can see in the example below that I was entering the command do show ip interface brief, and in the middle of it, an event was logged.
What happens is, it makes it hard to see where you're at in your command. It's actually quite easy in the example because I've highlighted in blue text. But when you're working at the command line, it's not going to be highlighted in blue and it's going to make it hard to see where you were in your command.
What you usually end up doing is just hitting backspace to delete everything and then start the command again, and it's a little bit annoying. You can stop that from happening by using the logging synchronous command.
This is done at the line level so you can configure it under a console line and in your VTY lines as well. You just enter the command logging synchronous like you can see below.
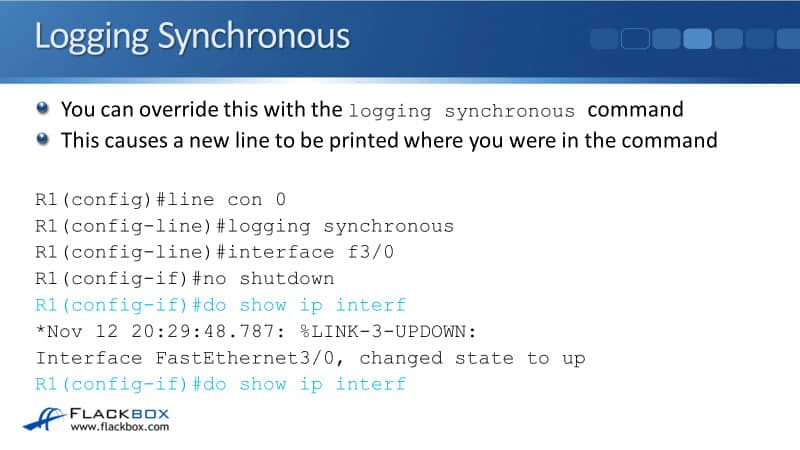
Once you do that, it's the same thing again. I'm in the middle of a command, I'm doing a do show ip interface brief but I haven't finished typing it yet. While I'm in the middle of typing that command, a logging event comes up.
Because of the enabled logging synchronous, it reprints the command that I was typing in, exactly where I was on a new line. I can now see exactly where I am in that command and I don't get confused. It's best practice to configure a logging synchronous on your lines, it just makes things more convenient.
Debug and Terminal Monitor
The last thing to tell you about, which is another thing that you're going to want to know about and because it's important and useful for the real world is, debug and the terminal monitor command. Show and debug commands can be used to view specific information over and above the Syslog messages.
Show output shows a static point in time state. You enter the command and it gives you the output of the state when you hit the enter key.
Debug output dynamically updates in real time, you could, for example, debug OSPF messages and as new OSPF events happen, they will be reported in real time in the command line. It keeps updating and it keeps giving you new information.
Debug is very useful if you're doing some troubleshooting. Be careful with debug commands in production environments though, a large amount of output can overwhelm the device. There are some debugs that will generate loads of information. It will all get written to the command line and will kind of lock you out of the device. Be careful don't run any of those commands on a production system.
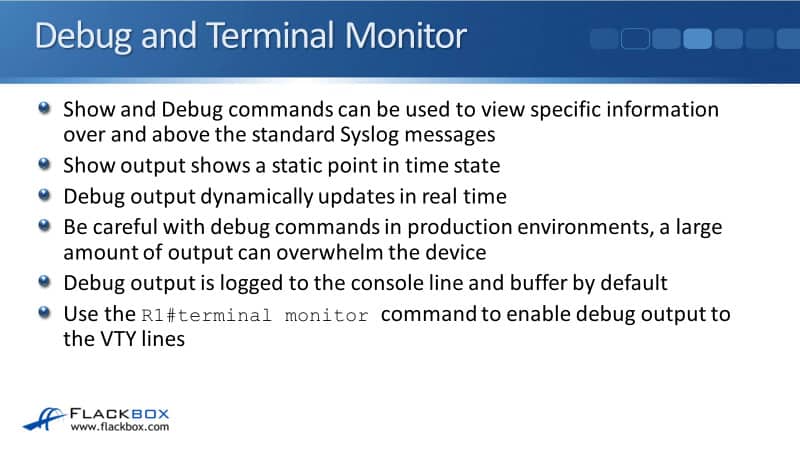
Debug output is logged to the console line and the buffer by default. If you do a debug and you're connected over a console line, you will see your output. You can do a show logging to see the output as well.
If you're logged in over a Telnet or SSH session, which you usually will be, and you enter a debug command, even though events are being generated, you're not going to see them in the command line.
This is something that trips up administrators that are new to Cisco devices all the time. To actually see the debug output being reported, you have to put in the terminal monitor command, and that is done the enabled prompt.
Cisco Syslog Configuration Example
This configuration example is taken from my free ‘Cisco CCNA Lab Guide’ which includes over 350 pages of lab exercises and full instructions to set up the lab for free on your laptop.
Click here to download your free Cisco CCNA Lab Guide.

- Configure SNMP communities on R1. Use Flackbox1 as the Read Only community string, and Flackbox2 as the Read Write community string.
R1(config)#snmp-server community Flackbox1 ro
R1(config)#snmp-server community Flackbox2 rw
2. Configure R1 so it will show events from all severity levels to the external Syslog server at 10.0.0.100.
R1(config)#logging 10.0.0.100
R1(config)#logging trap debugging
3. Verify you have set the correct severity level.
R1#show logging
Syslog logging: enabled (0 messages dropped, 0 messages rate-limited,
0 flushes, 0 overruns, xml disabled, filtering disabled)
No Active Message Discriminator.
No Inactive Message Discriminator.
Console logging: level debugging, 3 messages logged, xml disabled,
filtering disabled
Monitor logging: level debugging, 3 messages logged, xml disabled,
filtering disabled
Buffer logging: disabled, xml disabled,
filtering disabled
Logging Exception size (4096 bytes)
Count and timestamp logging messages: disabled
Persistent logging: disabled
No active filter modules.
ESM: 0 messages dropped
Trap logging: level debugging, 3 message lines logged
Logging to 10.0.0.100 (udp port 514, audit disabled,
authentication disabled, encryption disabled, link up),
2 message lines logged,
0 message lines rate-limited,
0 message lines dropped-by-MD,
xml disabled, sequence number disabled
filtering disabled
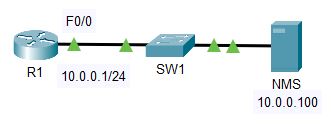
4. Enable then disable the FastEthernet 0/1 interface on R1.
R1(config)#int f0/1
R1(config-if)#no shutdown
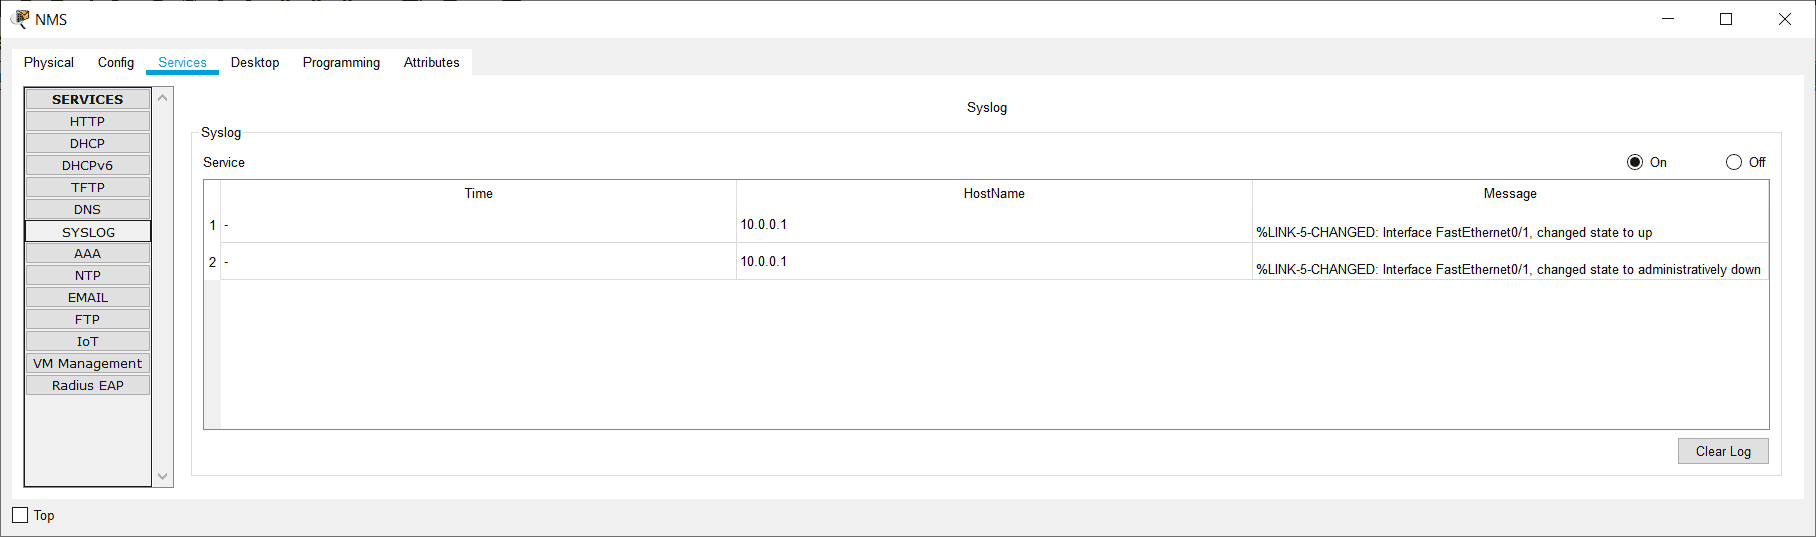
%LINK-5-CHANGED: Interface FastEthernet0/1, changed state to up
R1(config-if)#shutdown
%LINK-5-CHANGED: Interface FastEthernet0/1, changed state to administratively down
5. On the Syslog server at 10.0.0.100, click ‘Services’ then ‘SYSLOG’ and check you can see events for the interface coming up then back down.
Additional Resources
An Overview of the Syslog Protocol: https://www.ciscopress.com/articles/article.asp?p=426638&seqNum=3
System Message Logging: https://www.cisco.com/c/en/us/td/docs/routers/access/wireless/software/guide/SysMsgLogging.html
Cisco IOS Syslog Messages: https://networklessons.com/cisco/ccie-routing-switching/cisco-ios-syslog-messages
Libby Teofilo

Text by Libby Teofilo, Technical Writer at www.flackbox.com
Libby’s passion for technology drives her to constantly learn and share her insights. When she’s not immersed in the tech world, she’s either lost in a good book with a cup of coffee or out exploring on her next adventure. Always curious, always inspired.