In this Cisco CCNA tutorial, you will learn about AIOps, which is a general term that means Artificial Intelligence for IT operations. Scroll down for the video and also text tutorials.
Cisco AIOps Products Video Tutorial

Hassen Hannachi

Very well organized and delivered training. Well prepared labs and in-depth information about the topics covered make it easy to follow and grasp. Neil made the topics simple and easy to understand.
Cisco has a suite of different software products that fall under the AIOps umbrella and use AI to aid network operations.
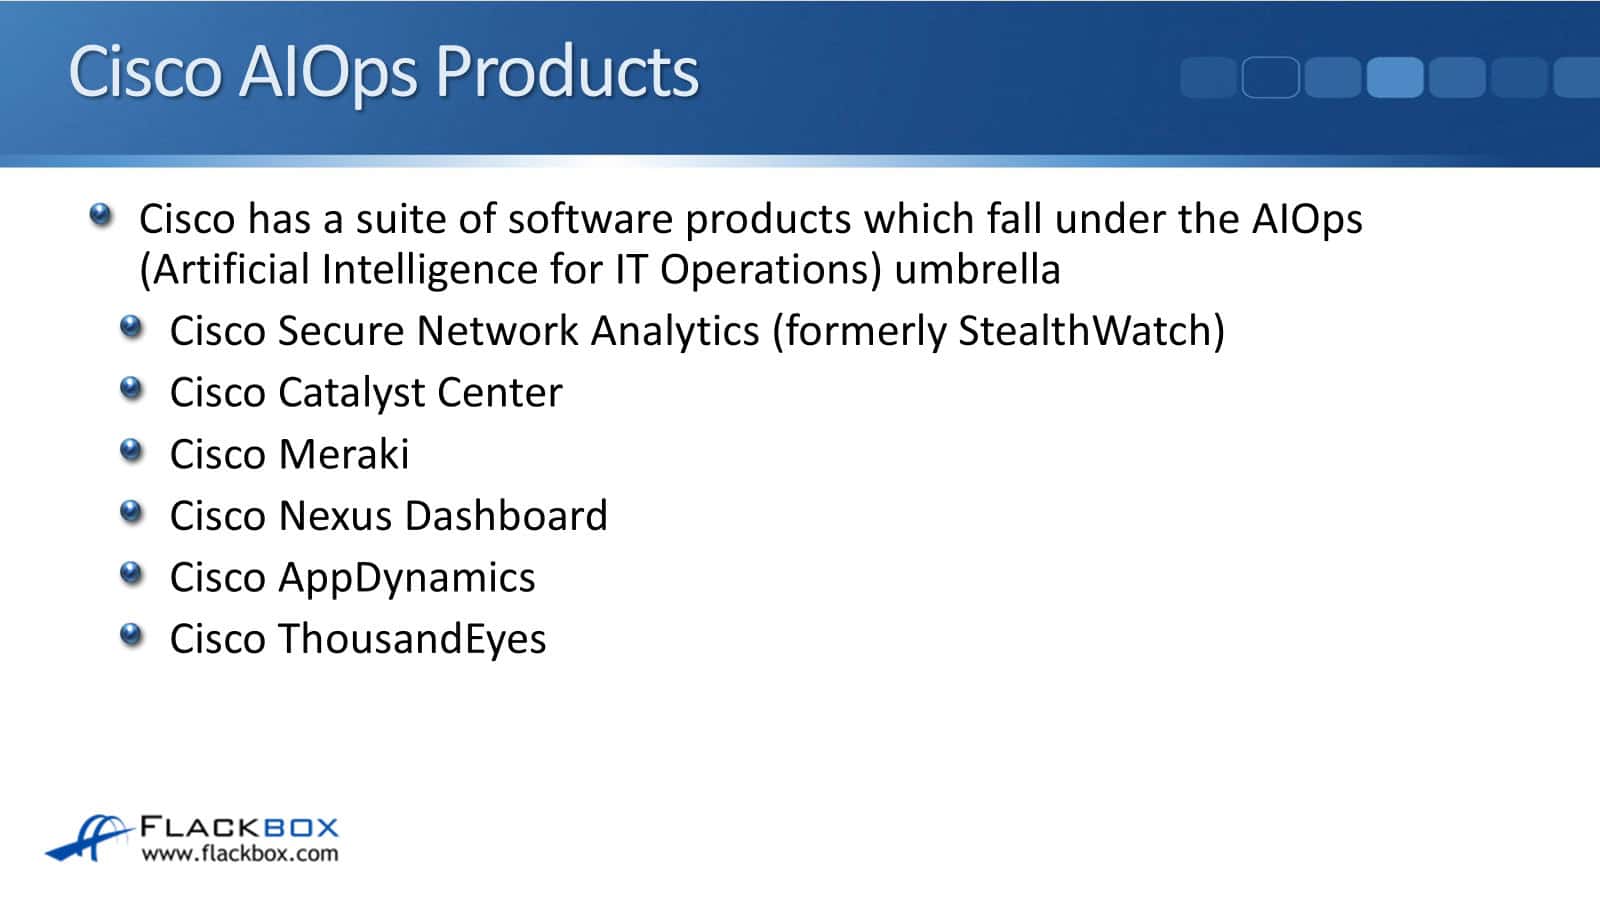
The products I will discuss here include Cisco Catalyst Center, Cisco Meraki, Cisco Nexus Dashboard, Cisco AppDynamics, Cisco ThousandEyes, and Cisco Secure Network Analytics. These are all different software products from Cisco that use AI to enhance their features.
Many of those software products have overlapping Machine Learning and AI capabilities. They all support traffic analytics, anomaly detection, and root cause analysis, and some of them also have ML and AI-driven automated configuration and management of network settings.
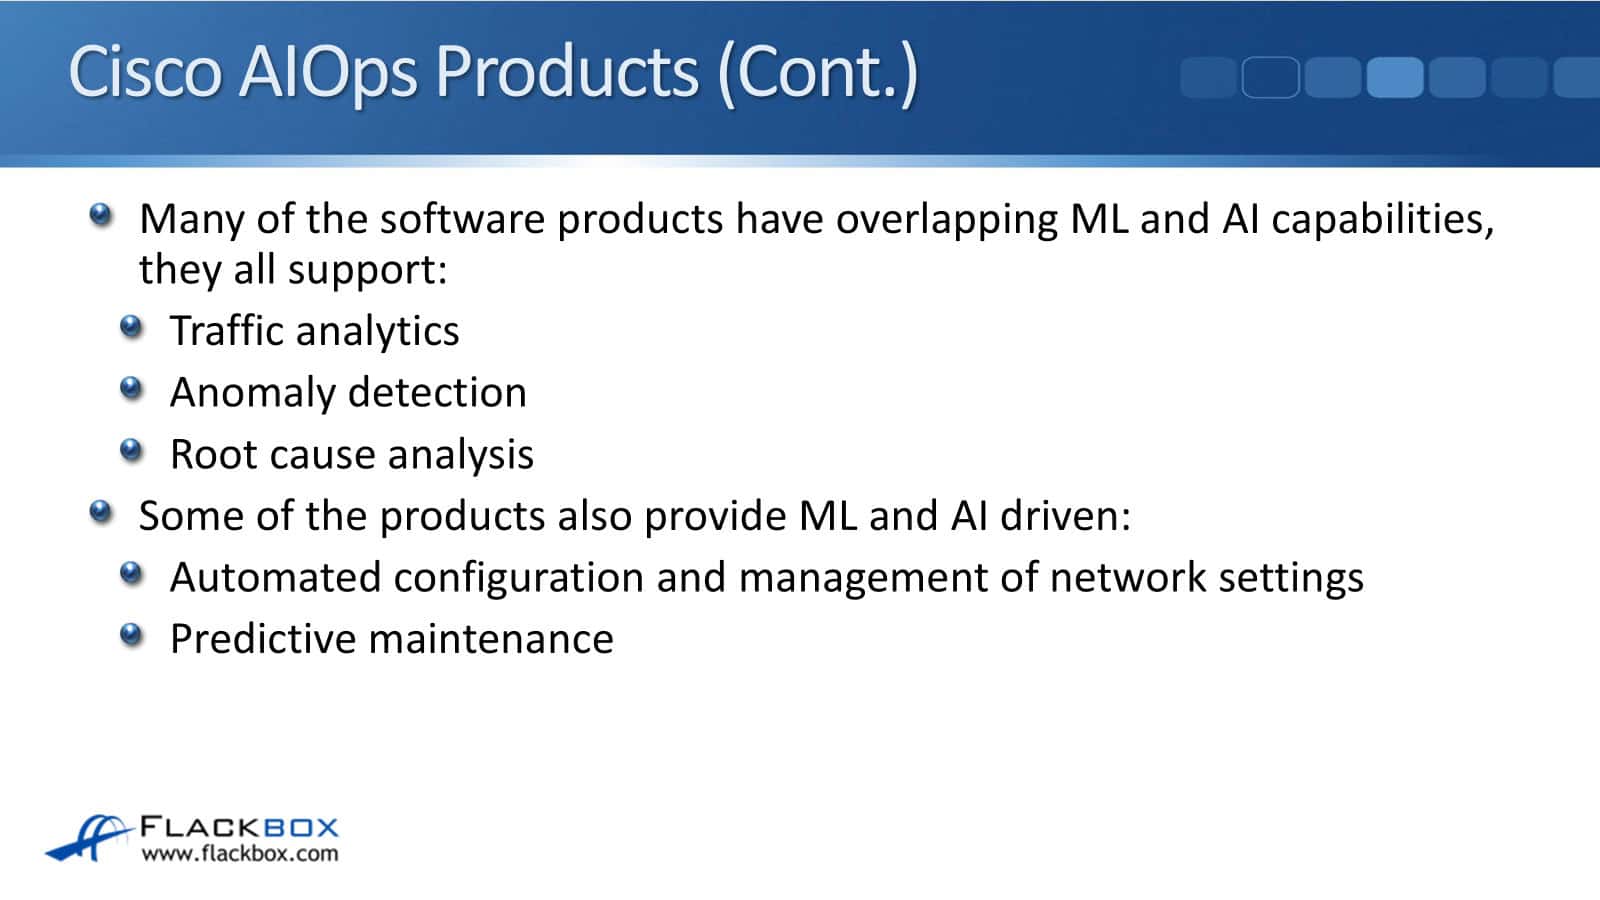
Therefore, they're able to push configuration to devices. Some of them also do predictive maintenance. So, you're probably wondering, “Why does Cisco have different software products that seem to be doing the same thing?” Well, there are multiple reasons for that.
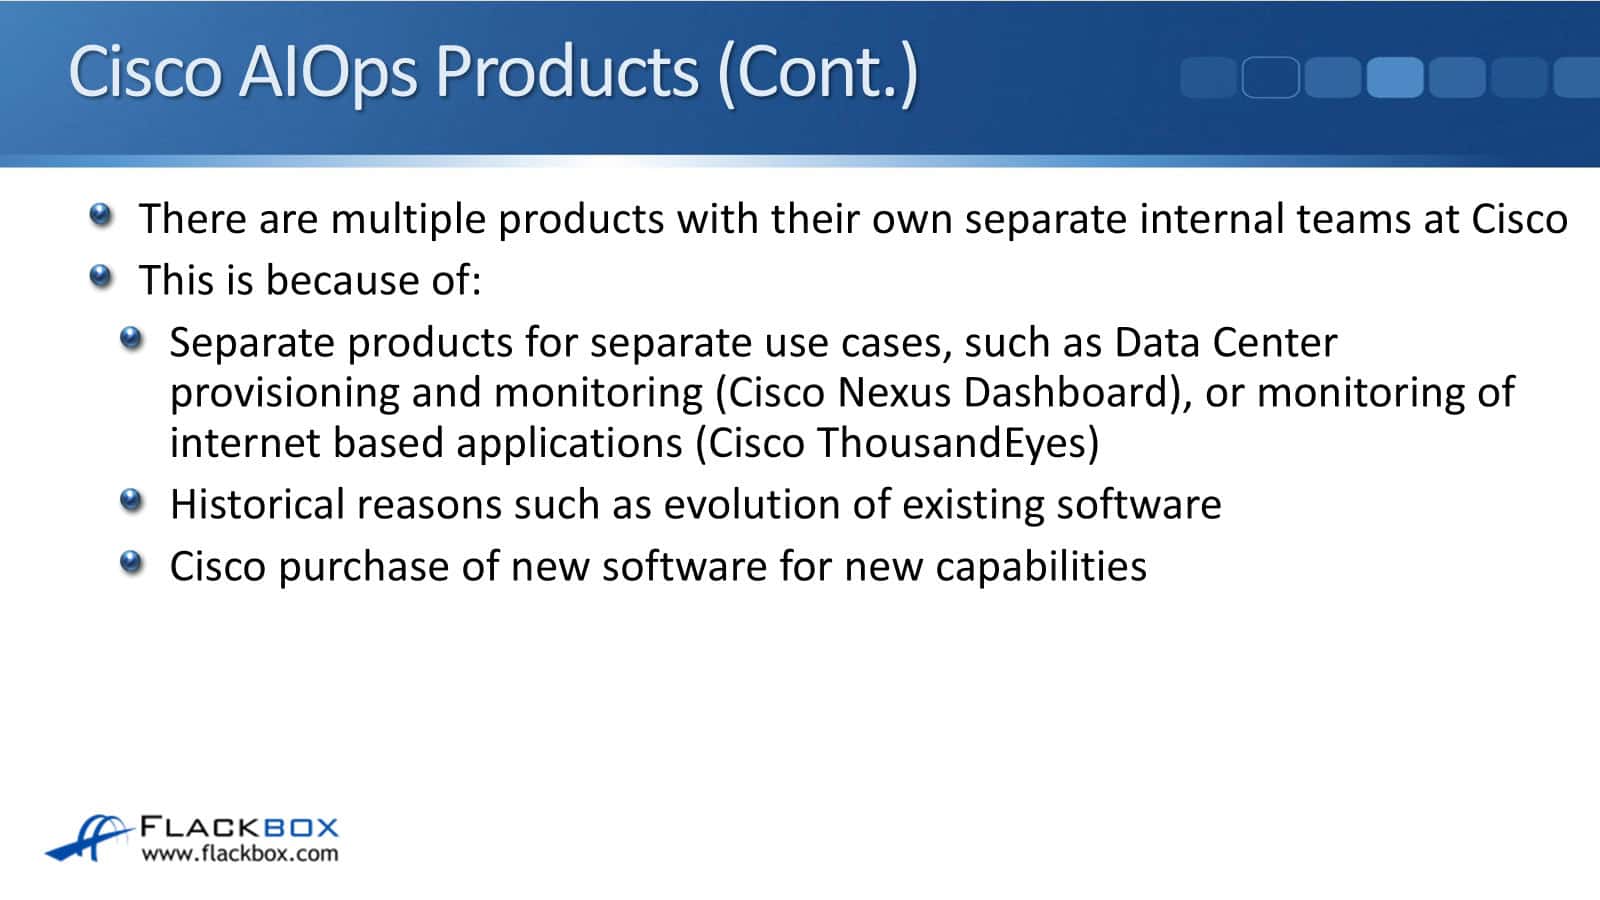
First, there's separate products for separate use cases. For example, Cisco Nexus Dashboard specializes in data center provisioning and monitoring, and Cisco ThousandEyes specializes in monitoring Internet-based applications.
There are also historical reasons, such as the evolution of existing software. The Cisco Nexus Dashboard actually comes from Cisco's purchase of the MDS storage area network switches that they did a really long time ago.
They acquired the company's monitoring software along with it, which has since undergone numerous versions and name changes to become the Cisco Nexus Dashboard.
Another reason is that Cisco purchased new software for new capabilities. That's why they bought ThousandEyes. With ThousandEyes, it's got a large Machine Learning data set that is monitoring out the public internet and cloud providers.
Cisco didn't have that capability before, and that's why they bought ThousandEyes. There are lots of different software products from Cisco.
At Cisco, each feature has its own distinct internal teams responsible for its development and management. There is quite a bit of overlap between the features, but those are the reasons why.
Cisco Catalyst Center AI Features
Cisco Catalyst Center features AI Network Analytics, which continuously collects and analyzes network data. It aids in issue detection and provides AI-driven network traffic baselining and anomaly detection. It checks what the normal traffic patterns are in your network, and it detects any changes from that.
Network traffic benchmark comparison with other networks. You can compare your traffic patterns and performance with other networks and get proactive insights for pattern and trend identification.
Looking at Cisco Catalyst Center, which used to be called DNA Center, we can go to the Assurance and Issues tab, and in there you can click on AI-driven. This is where it has detected issues with its Artificial Intelligence.
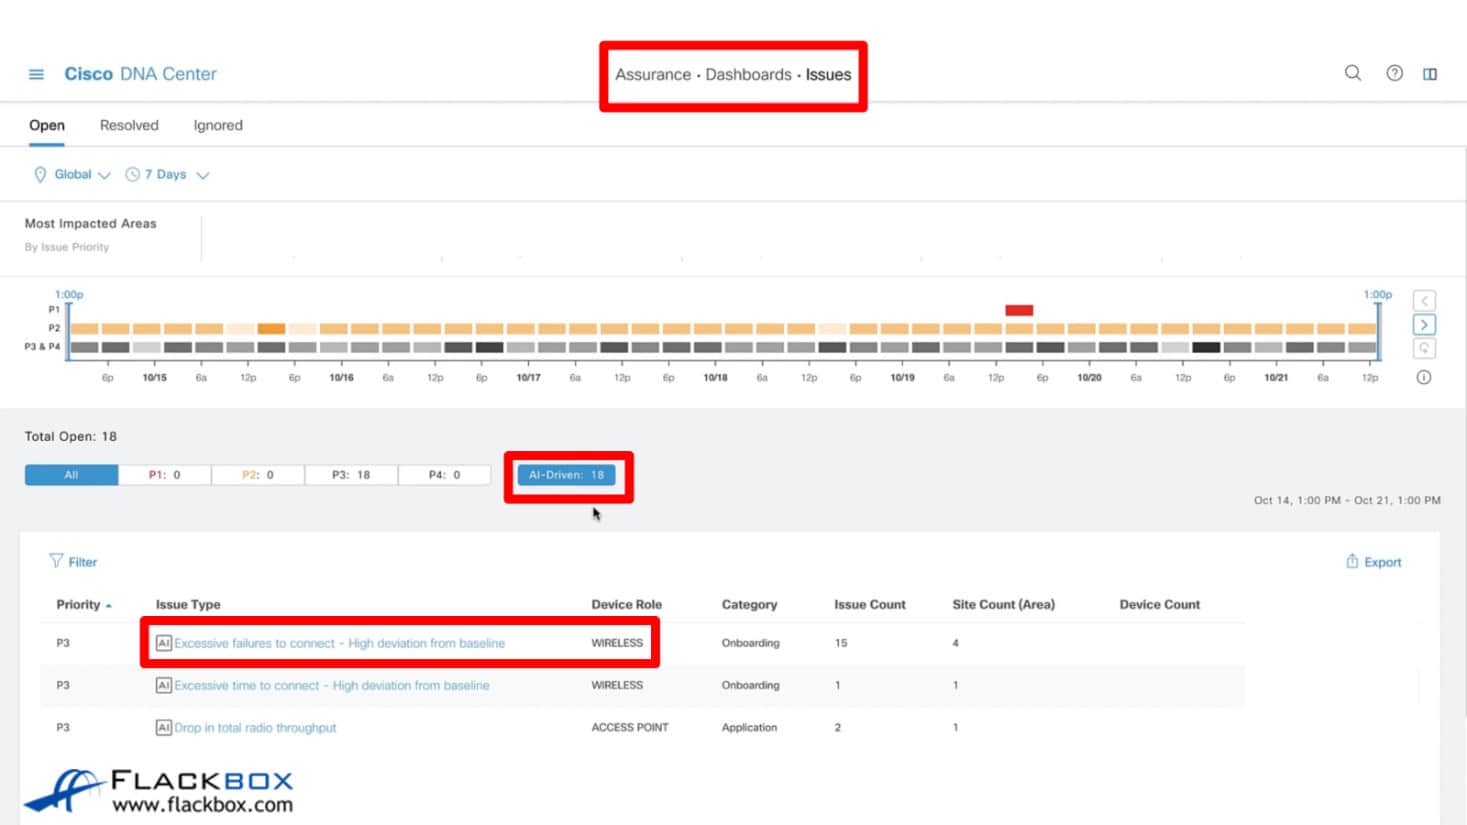
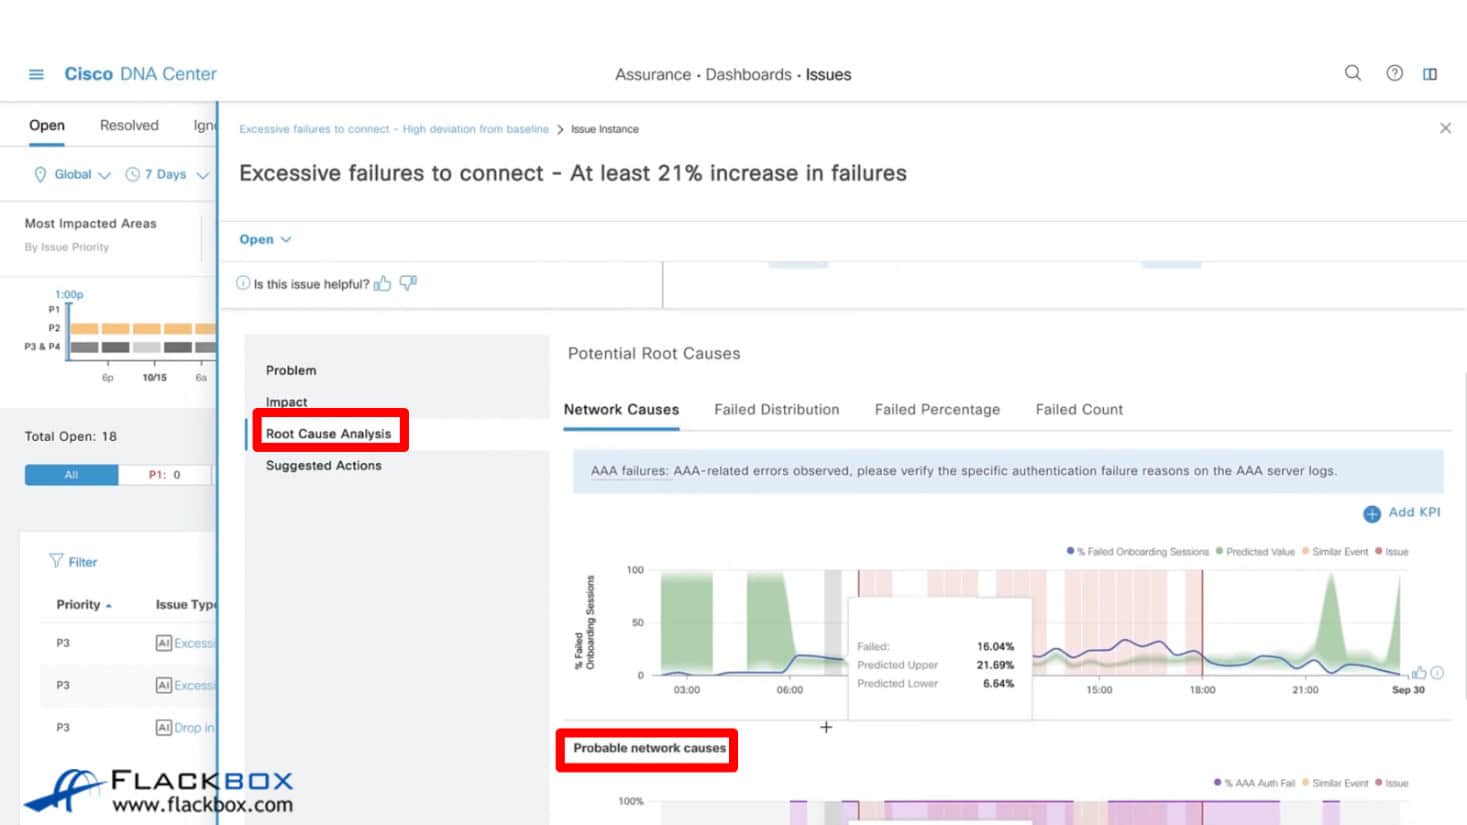
As you can see, we are currently experiencing an issue on one of our wireless access points with excessive failures to connect. A lot of clients are failing to connect more than usual. We can click on that to drill down into that particular issue. On that page, we can see this is why it's been reporting there's a 21% increase in failures.
We can then click on the Root Cause Analysis tab. Scroll down, and we can see the probable network causes, and it will tell us what it thinks is probably causing that issue. So, it's really helpful for troubleshooting.
We can also look at the Assurance and Network Insights tab. In here, we can see that our AP's are experiencing deviations in their client count. We can also see how many clients are connecting to that particular AP.
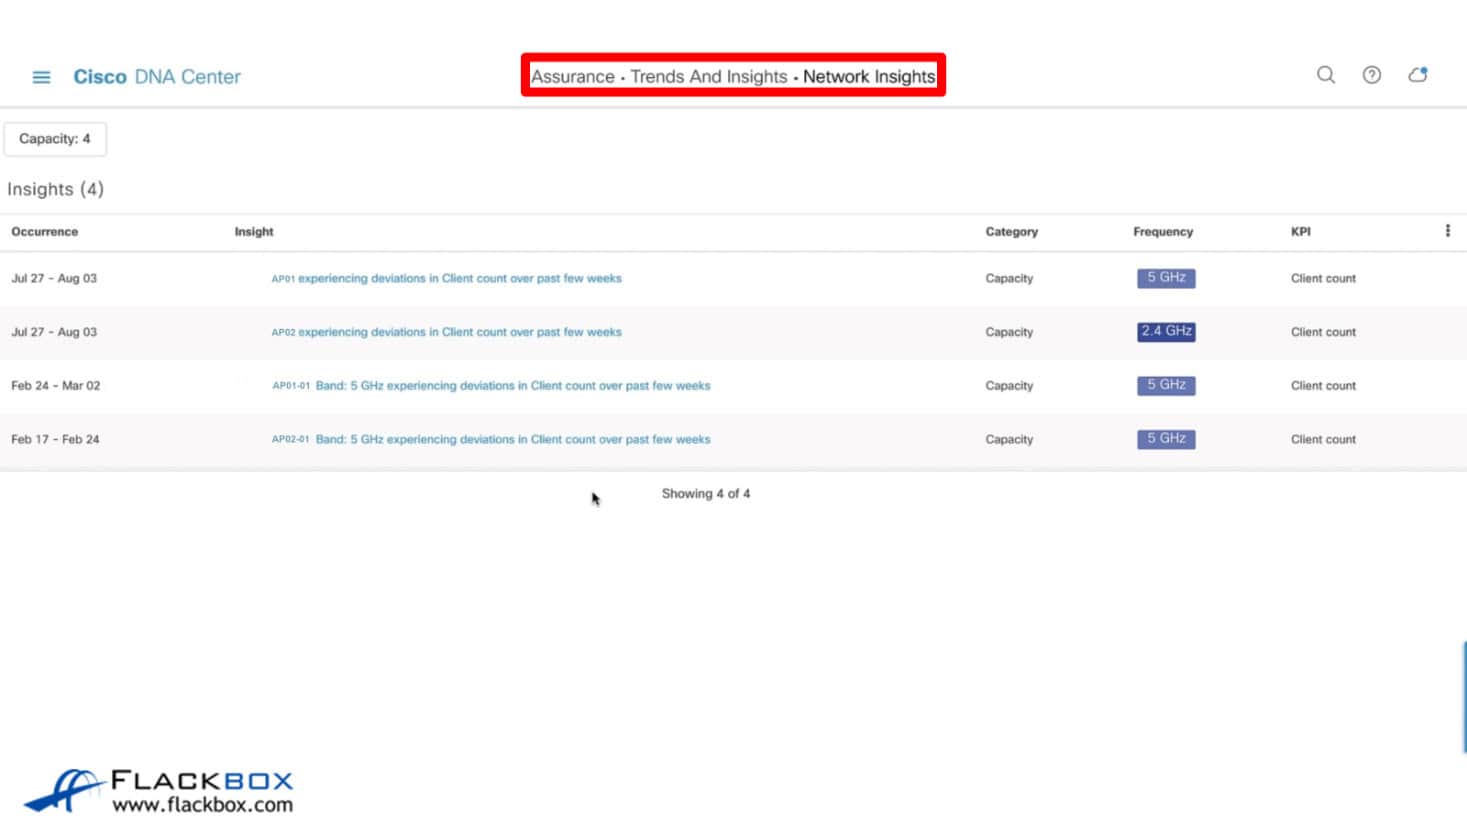
Again, we can click on there and drill down. If we scroll down, we can see the number of clients that the AP typically accepts on a weekly basis. In this example, there has been a significant increase in the client count. This will help us with capacity planning.
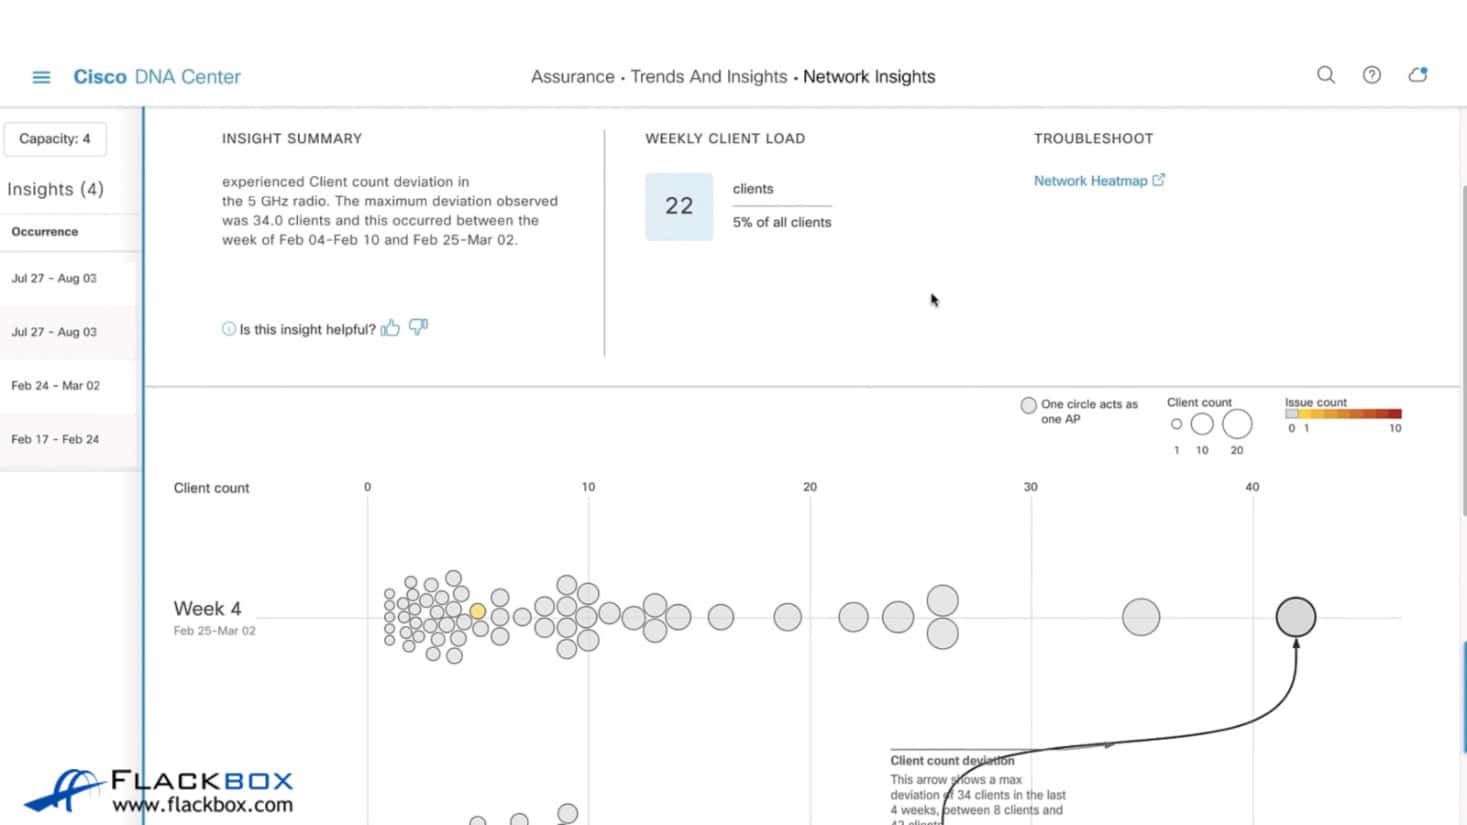
Also, we might want to check why this AP is getting so many more clients. Is that legitimate or not? If it is legitimate, then we need to do capacity planning. Maybe we need to put in an additional AP in there to handle the load.
Cisco Meraki AI Features
Next software product to cover is Cisco Meraki. The AI features of Meraki include Meraki Wi-Fi network visualization, management, and monitoring with wireless assurance. Assurance just means that you're assuring that things are working as you expect them to be working.
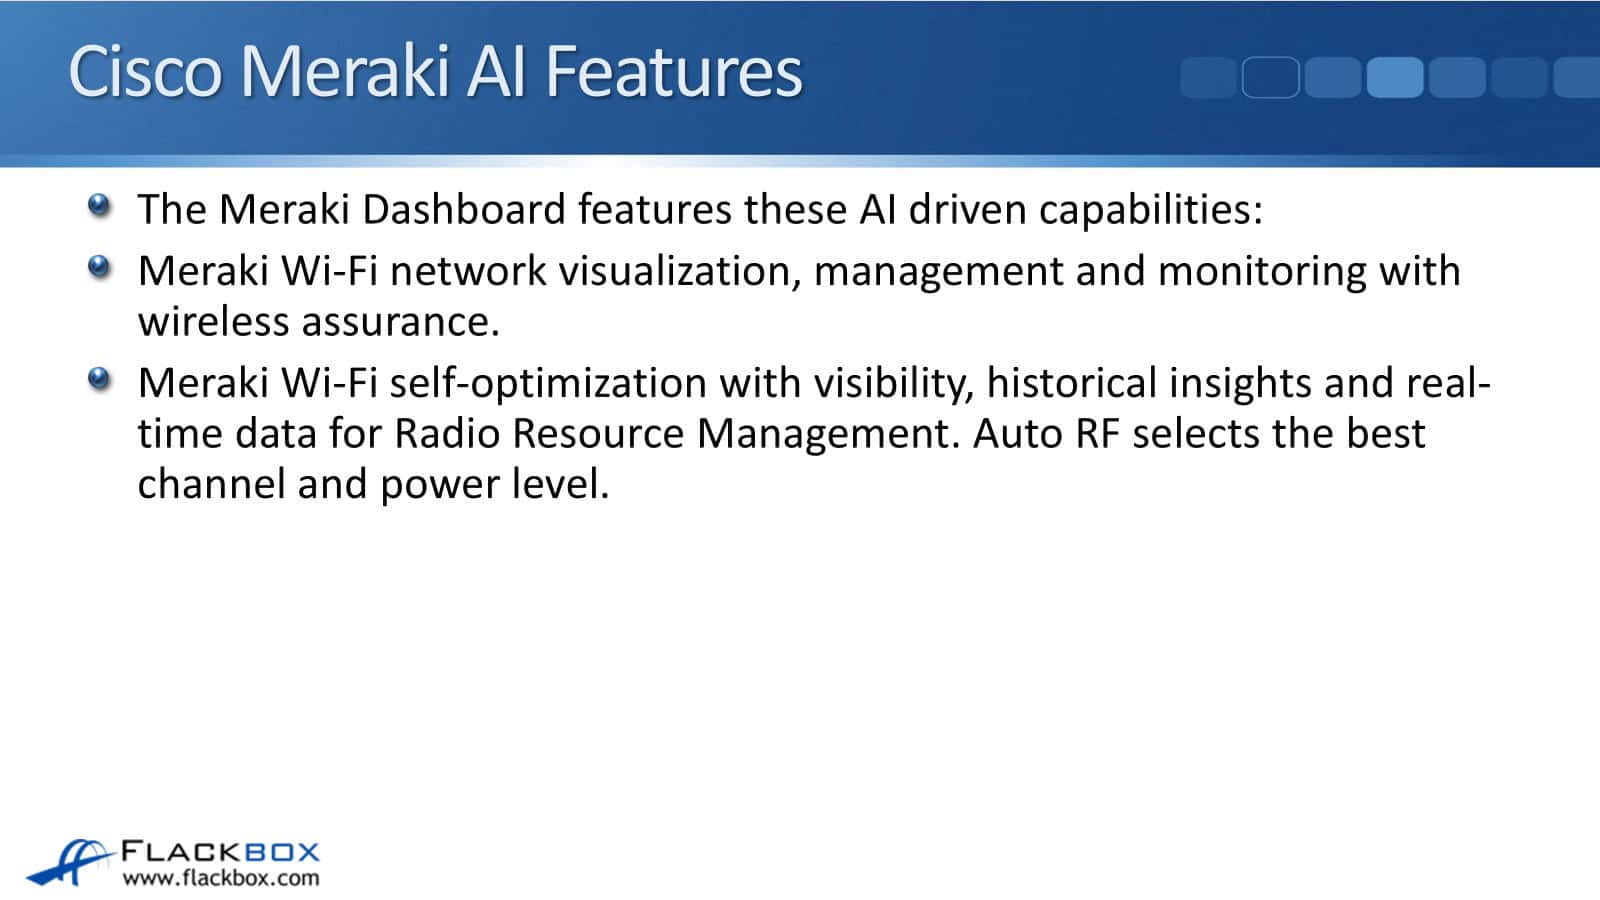
Meraki Wi-Fi itself optimizes with visibility, historical insights, and real-time data for radio resource management. An example of this is the Auto RF feature, which automatically selects the best channel and power level on your AP's.
Cisco Meraki Auto RF
The Auto RF feature allows your APs to transmit their radio frequency data to the Meraki Cloud. It is anonymized, so there is no private enterprise information going in there. Then, the optimized configurations are sent down to the AP.
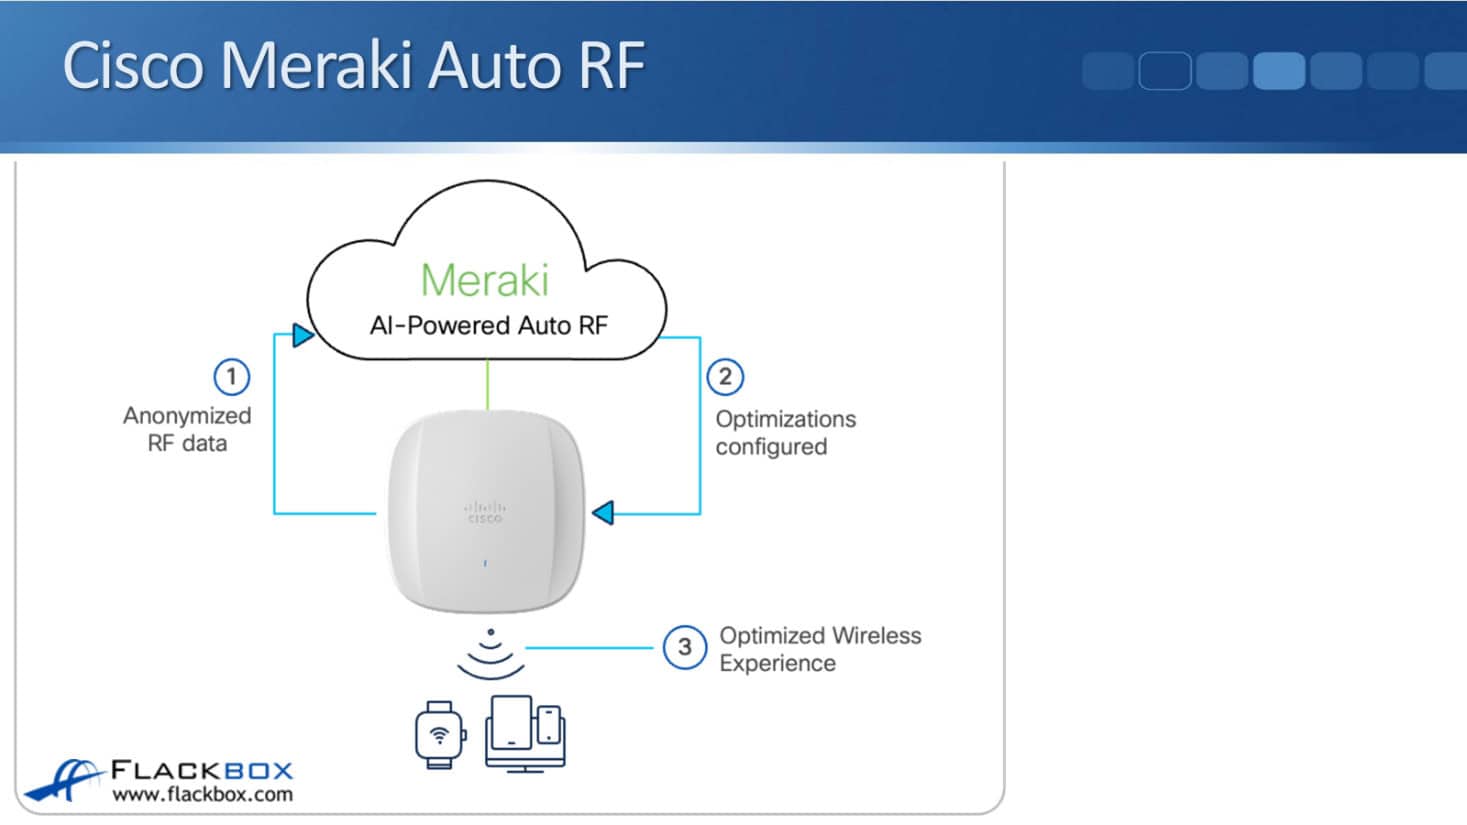
It uses AI to analyze that data and then check what is the best power level and channel for that particular AP, and it automatically sends it down there. Therefore, you don't have to do anything manually. You just enable this feature, and this will automatically work for you.
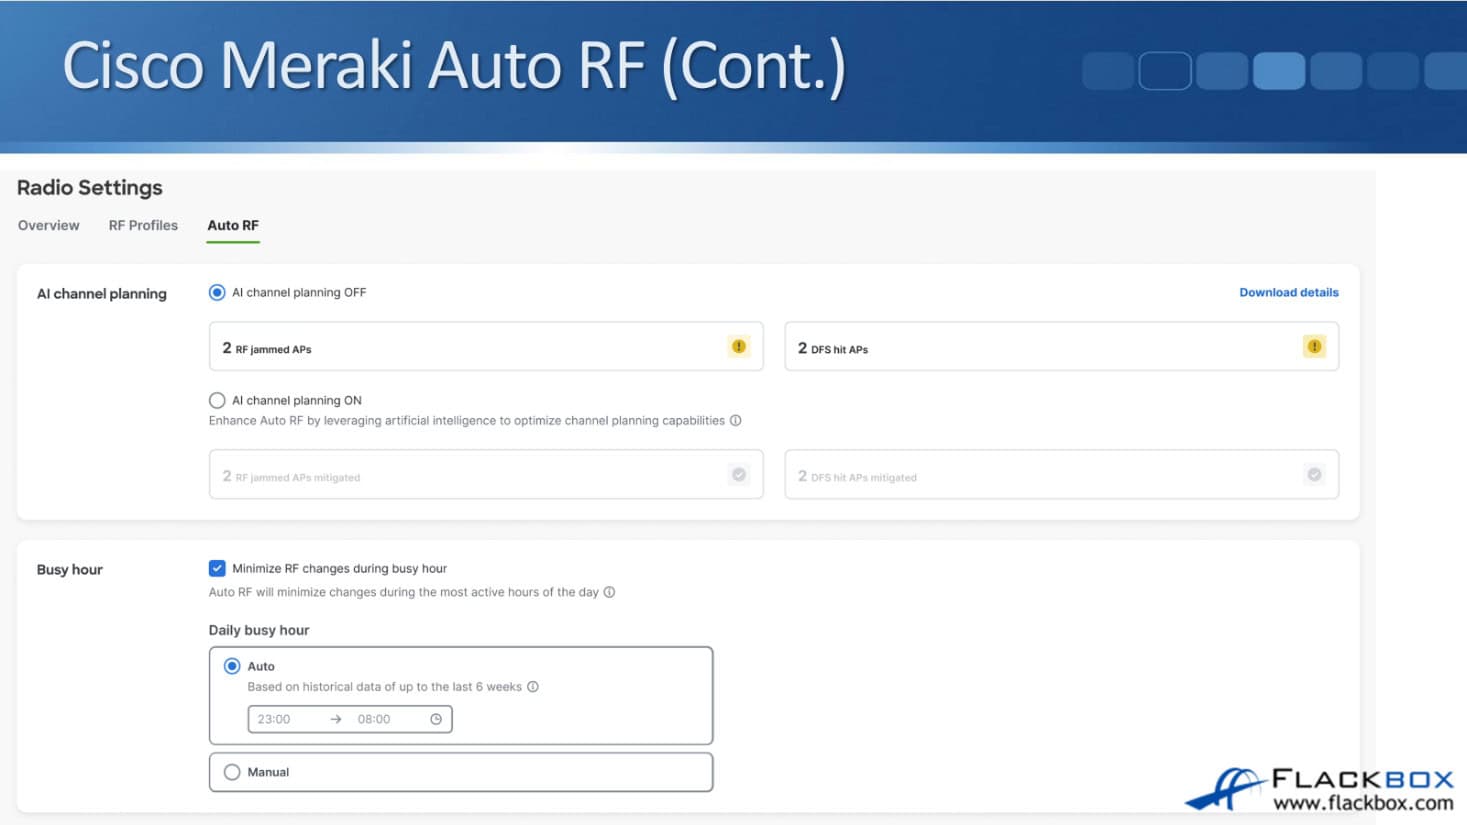
To enable it, navigate to Radio Settings, select Auto RF, and then tick the radio box to activate AI channel planning. You can also say what your busy hour is.
This will automatically change the channel, which can cause client drops. In here, you can configure it to do that only out of office hours so that you minimize any possible disruption.
Cisco Nexus Dashboard
The next software product is Cisco Nexus Dashboard, which is a single pane of glass application. You've got a single GUI that you can manage everything from.
It's designed for automated provisioning, monitoring, anomaly detection, and capacity planning of data centers with NX-OS, Nexus, and MDS switches. It does not currently work with Catalyst.
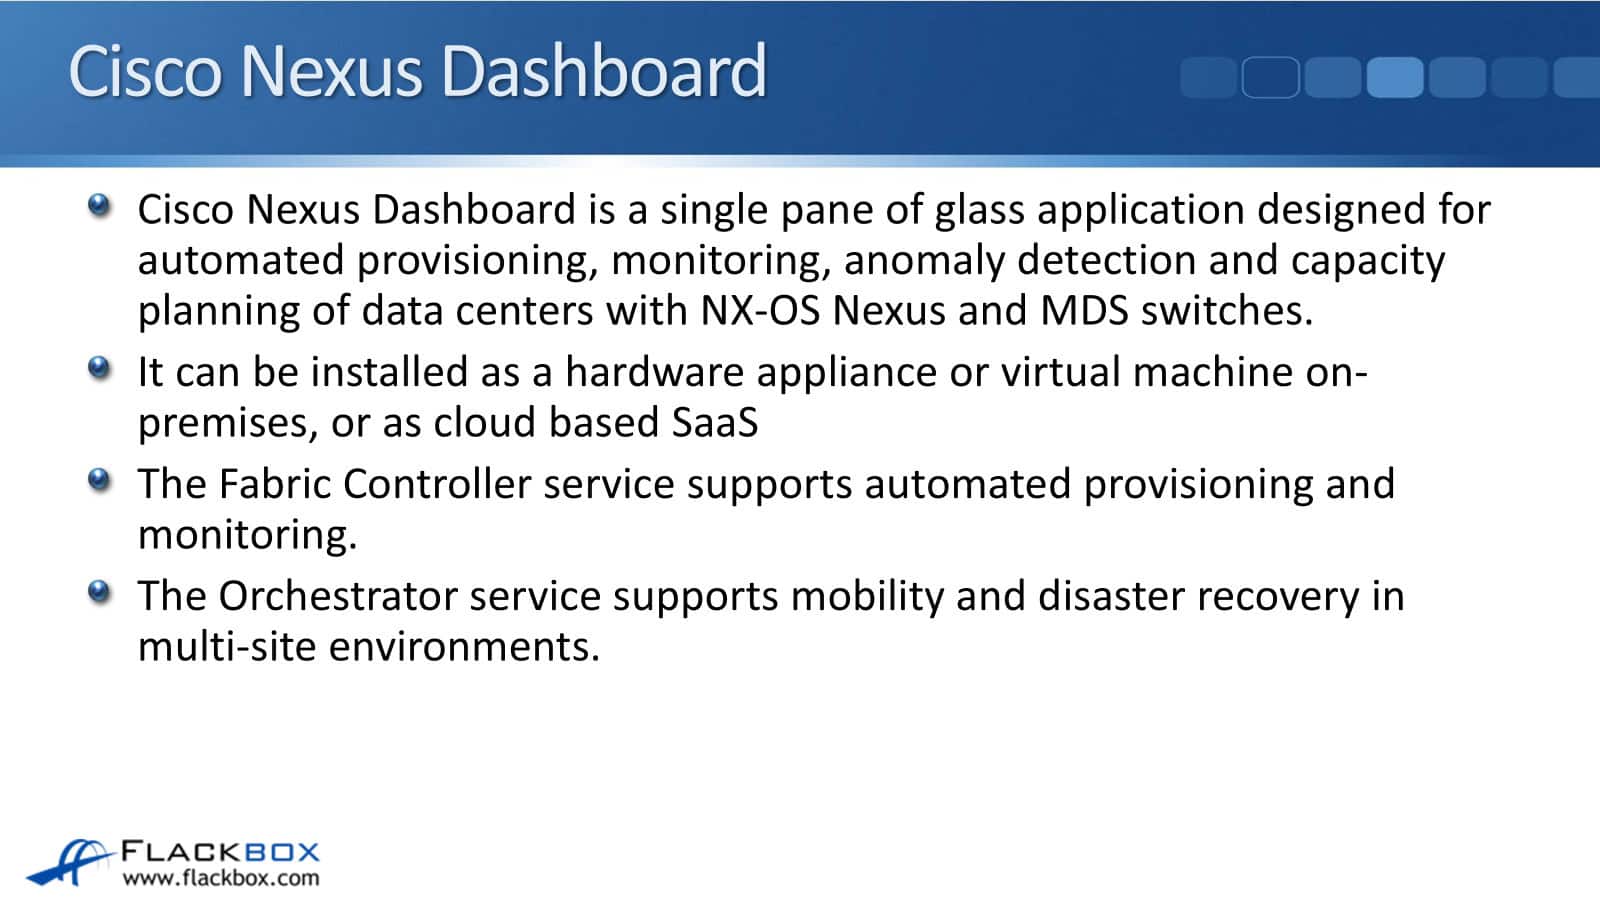
If you've got a data center that is using NX-OS devices, you will find this useful software. You can install it as a hardware appliance, a virtual machine, on-premises, or as cloud-based Software as a Service (SaaS).
There are different services inside the Nexus Dashboard. The first one is the Fabric Controller service that supports automated provisioning and monitoring. The next one is the Orchestrator service that supports mobility and disaster recovery in multi-site environments.
The fabric controller provides a topology diagram of all your devices. You can use it to monitor device configurations, push new configurations to them, and monitor and update software versions, among other things.
If you have multiple data centers, you use Orchestrator. It allows you to move virtual machines between your different data centers depending on what the current load is. Additionally, if one of your data centers experiences a failure, it can automatically transfer all your virtual machines to your backup data center.
Cisco Nexus Dashboard Insights
When you access the Cisco Nexus Dashboard, you'll notice that it contains Insights. Insights is the one that is driven by AI. You can click on the drop-down, and you can choose Fabric Controller there. Then, you'll see all the different fabric controller features.
You have the option to select either the Orchestrator or the Insights features. Insights uses Machine Learning and Artificial Intelligence to provide traffic analysis, anomaly detection, and root cause analysis.
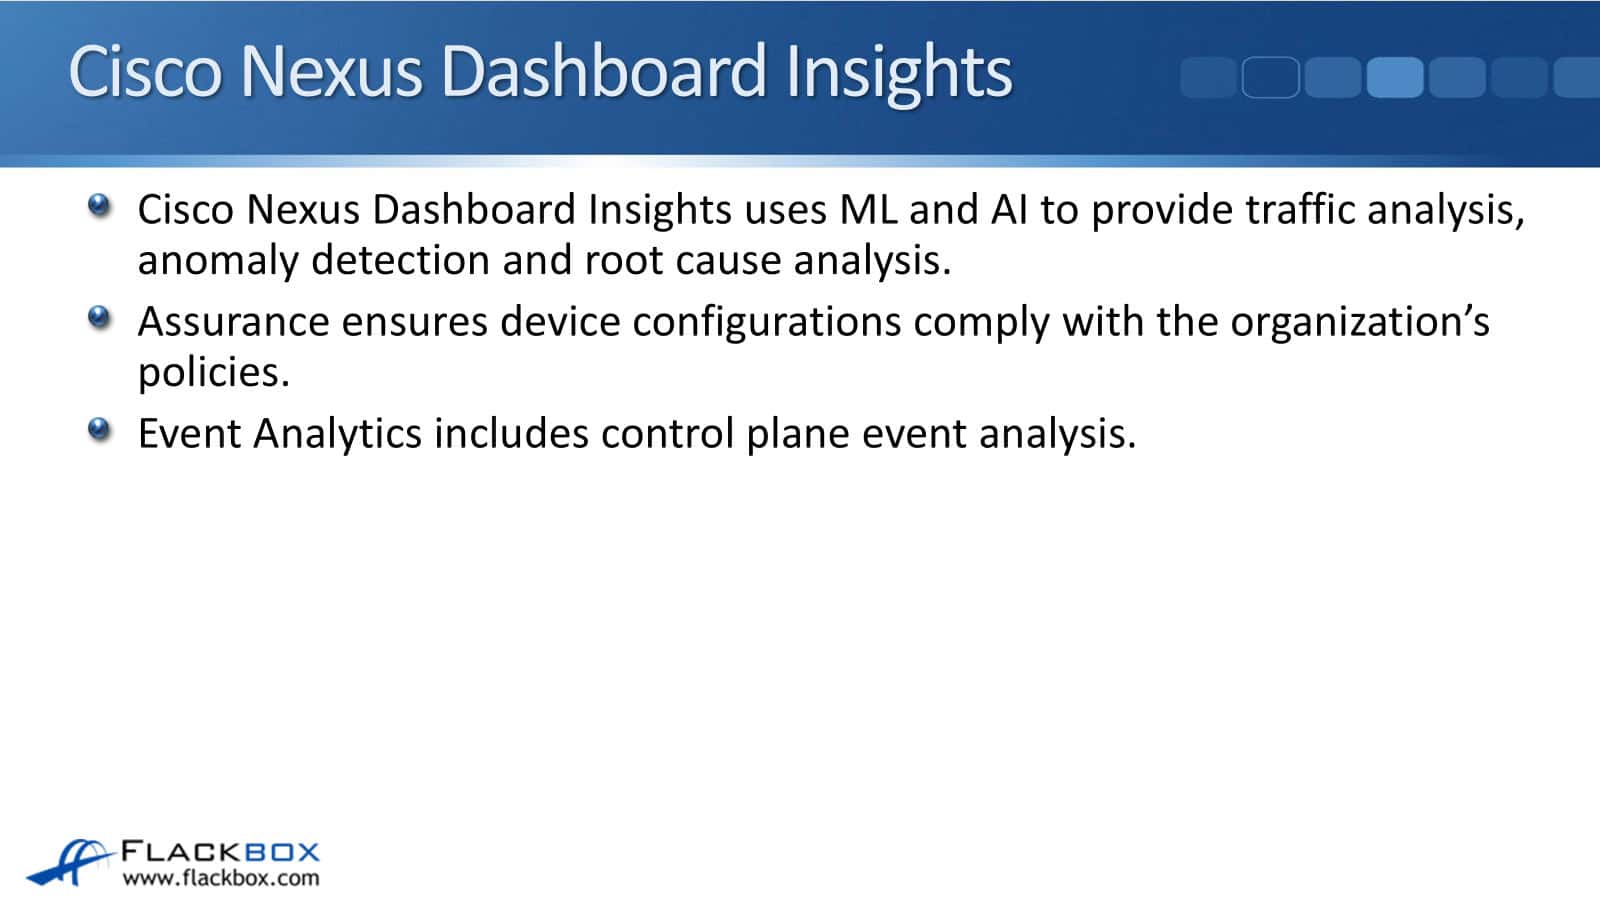
Assurance ensures device configurations comply with the organization's policies. Not just their running configuration, but also software versions, hardware capacity, etc. The event analytics in there include control plane event analysis.
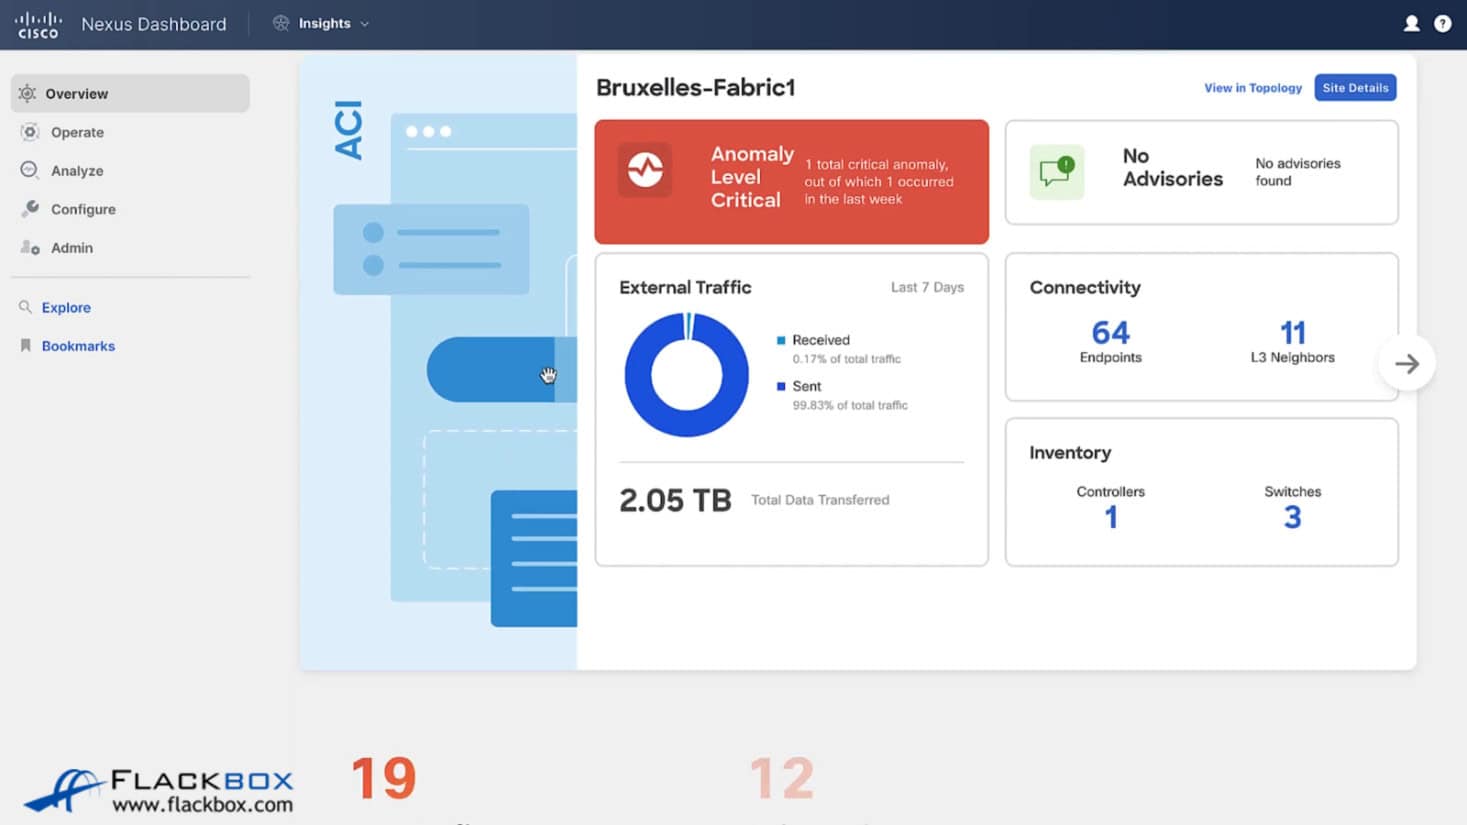
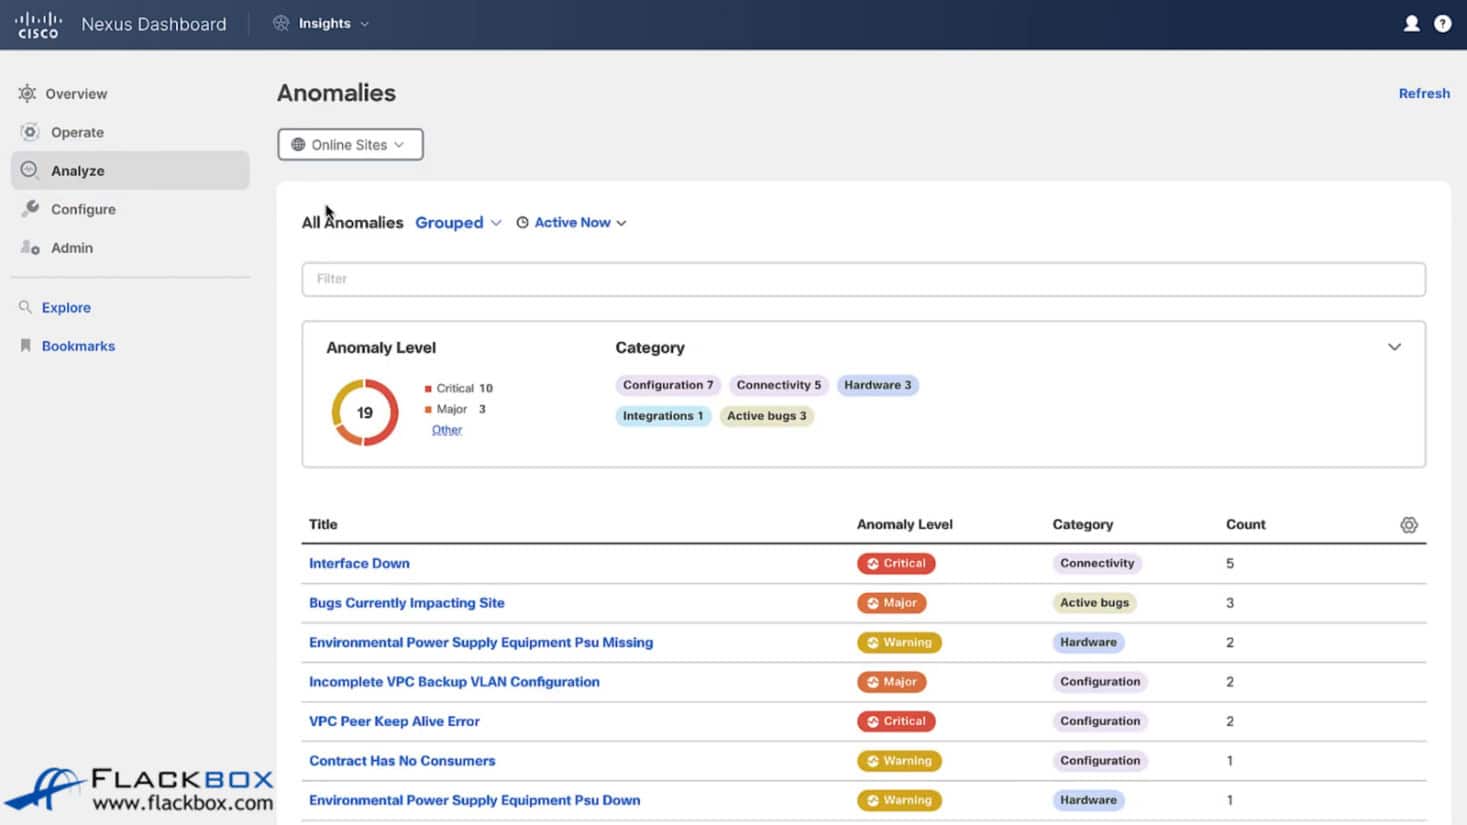
Looking at Cisco Nexus Dashboard Insights, you can see the overview. The dashboard shows that we've got a network traffic anomaly being reported in here. We can click on there to drill down.
Another thing you can go to is the Analysis Hub under the analyze tab. In there, you've got multiple different options, which are pretty much all using ML and AI. You have a compliance feature that allows you to monitor your fabric's compliance with custom anomaly rules.
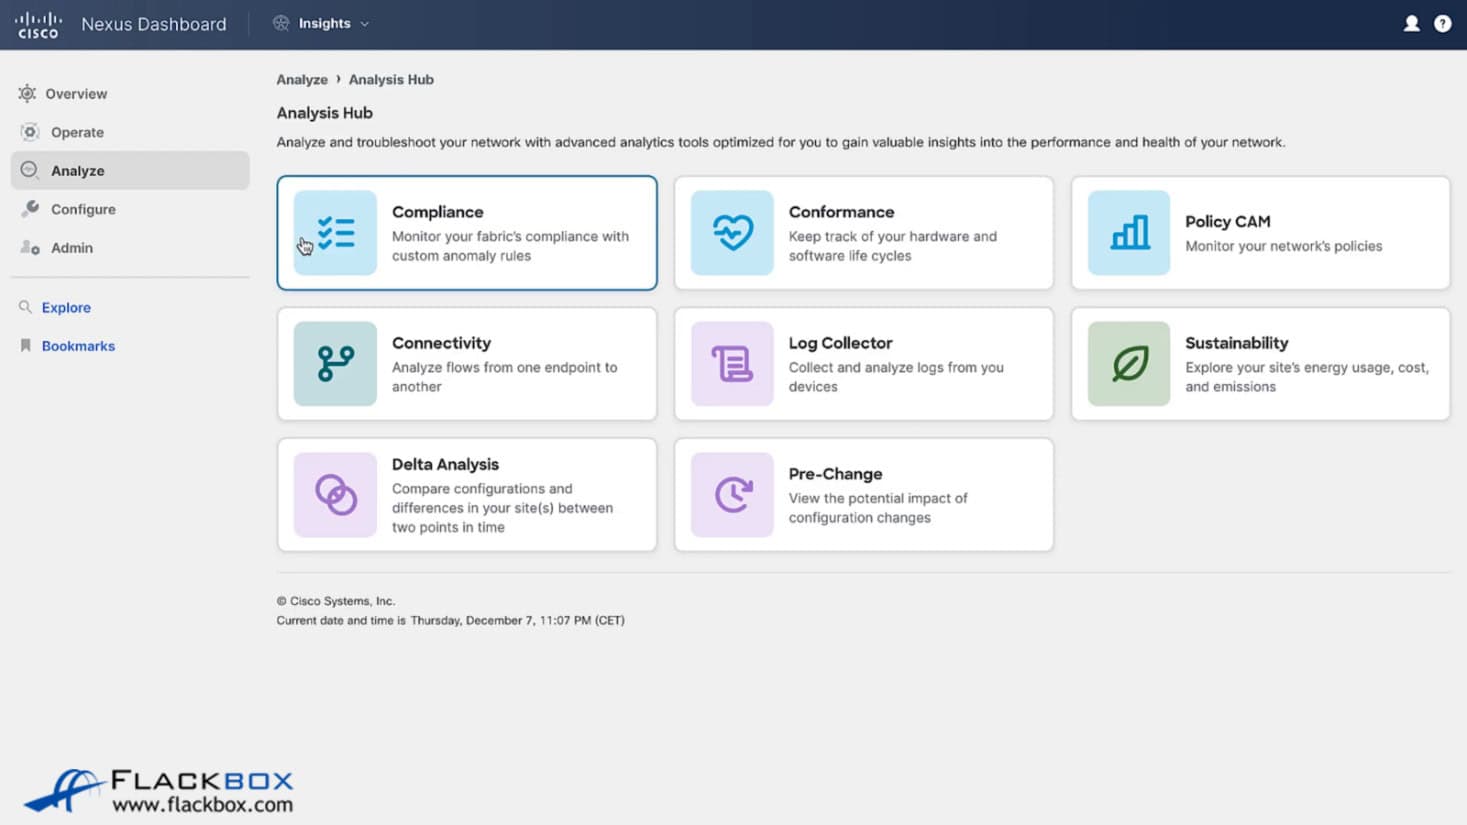
The data center's fabric consists of the switches and their interconnections. So, you can configure custom anomaly rules in there. You can configure it with what your expected configurations and network traffic are, and it will report on any anomalies.
Conformance keep track of your hardware and software life cycles, so you can check things like software versions in their Policy CAM and monitor your network's policies, such as QoS.
Under Connectivity, you can analyze flows from one endpoint to another. This uses historical data, and you can see what your historical traffic flows were useful for troubleshooting. The Log Collector displays the logs generated by the devices.
Sustainability provides information such as energy usage and calculates the associated costs. We have a feature called Delta Analysis, which allows us to compare configurations and differences in your site between two points in time. Obviously, that's using Machine Learning.
Lastly, with Pre-Change, you can view the potential impact of configuration changes. That's lots of useful AI features in there. If we go to anomalies, it will report on all the different anomalies.
Anomalies are the problems that we've got happening in our site, such as we have five interfaces that are currently down. We can click on that to drill down and see which are the interfaces that have the problem.
Cisco AppDynamics
Cisco AppDynamics monitors applications and their infrastructure. It actually monitors application performance, but it takes in that it's aware of the underlying network infrastructure as well.
You can install the AppDynamics service on Linux or Windows, either on-premises or as a cloud-based SaaS. Agents on the application servers report their statistics to the AppDynamics controller.
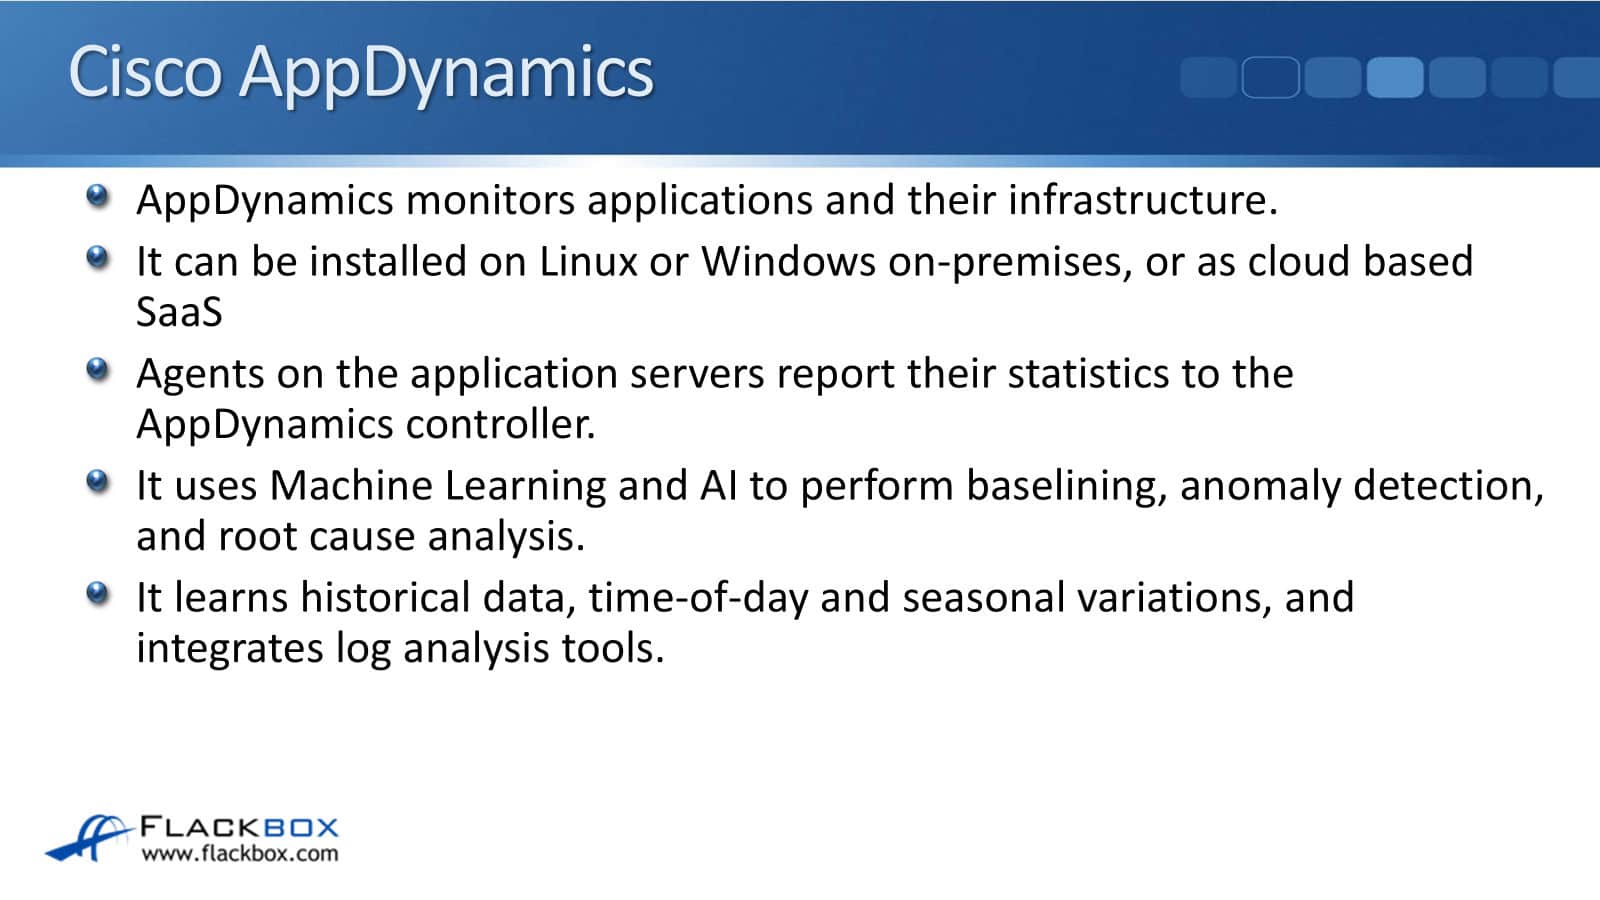
An agent is a piece of software that you install on your application server, for example, a Java application. It then reports all of its statistics and its performance up to the AppDynamics controller, which is your central pane of glass for monitoring this. It uses Machine Learning and AI to perform baselining.
Baselining involves identifying the typical patterns and performance of an application, detecting anomalies, and conducting root cause analysis. It learns historical data, time of day, and seasonal variations and integrates log analysis tools. Again, it's using Machine Learning for that.
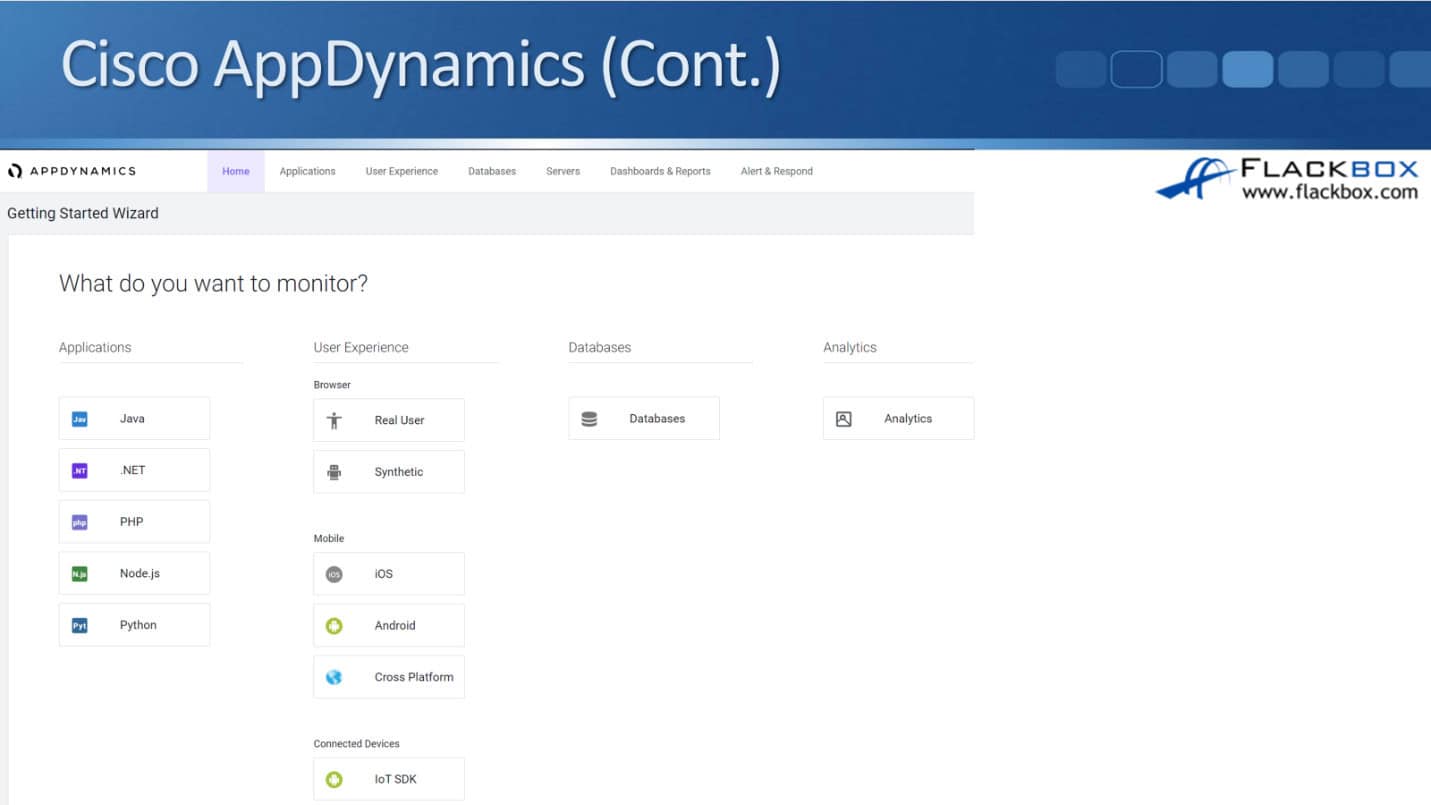
Looking at AppDynamics after you've just installed it, you'll see the getting started wizard. You can see the different apps you can monitor, for example, Java and Python apps.
You can also monitor from the end user's point of view, so you can test the application from that point of view. There’s also mobile databases and analytics.
Cisco AppDynamics – App Dashboard
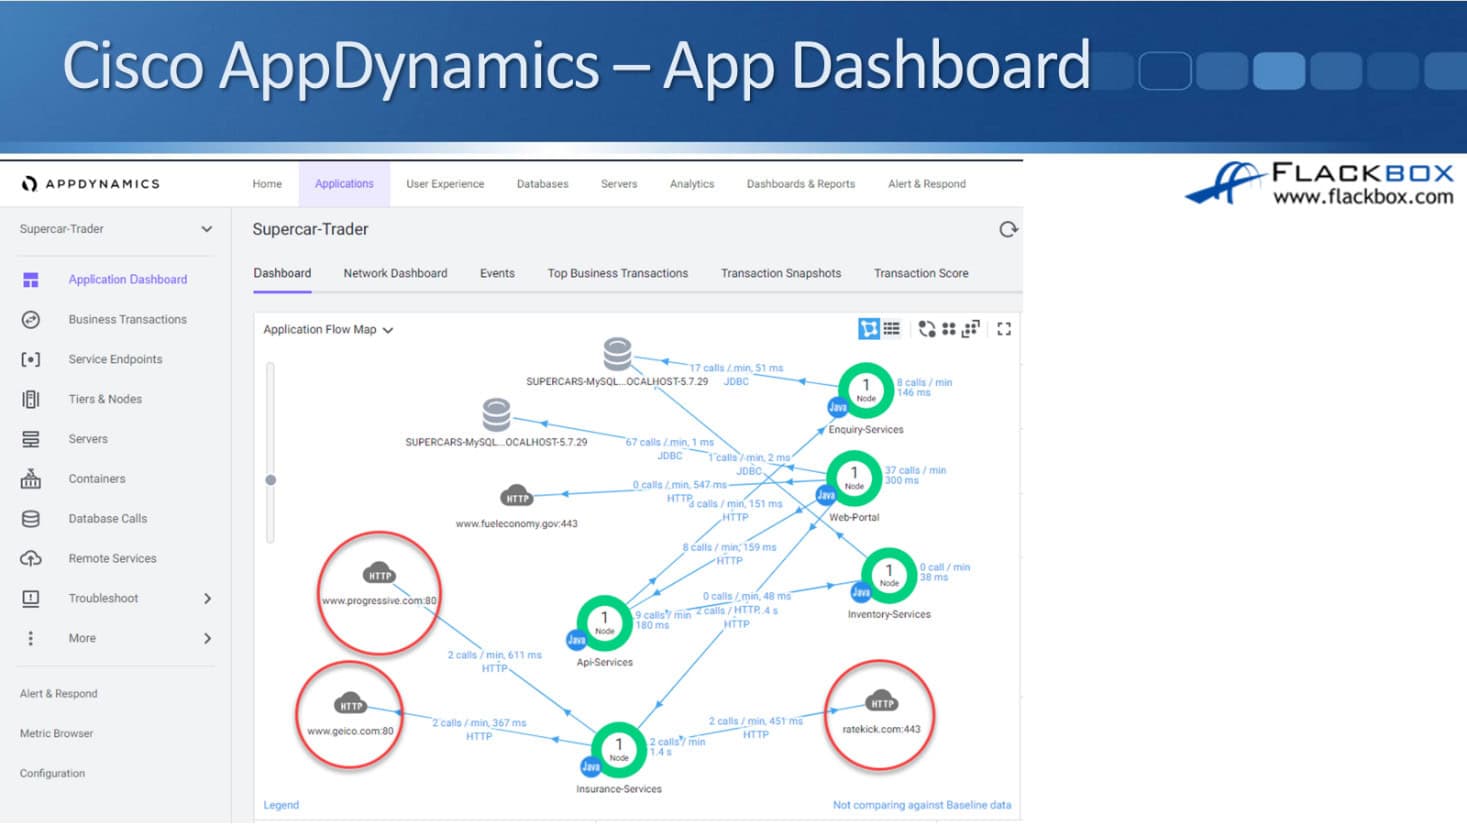
In this example, we have got a Java application, and it has a web front end and a SQL database. We have gone and installed the agent on that Java application, and we've pointed it at our controller.
When you do that, it reports all its information to the controller. You can view all the services that comprise that application and their interconnections.
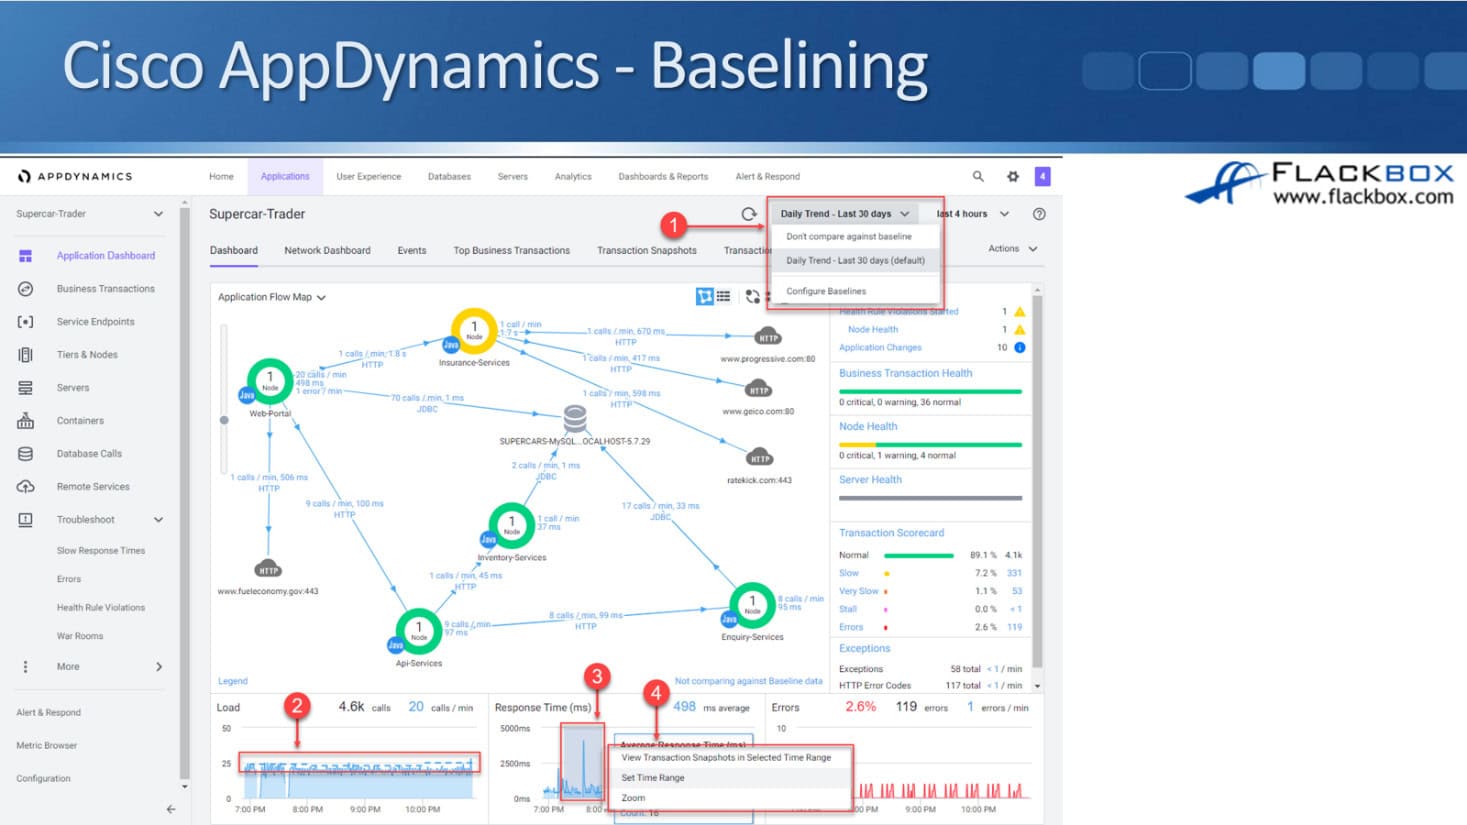
Cisco AppDynamics - Baselining
On the dashboard, you can check the daily trends over particular time periods. You will receive information about the application's load and its response time. You're monitoring the application here, but it's important to note that it operates over a network.
Cisco AppDynamics - Transactions
You can also view your different business transactions. You can click on them to drill down for further information.
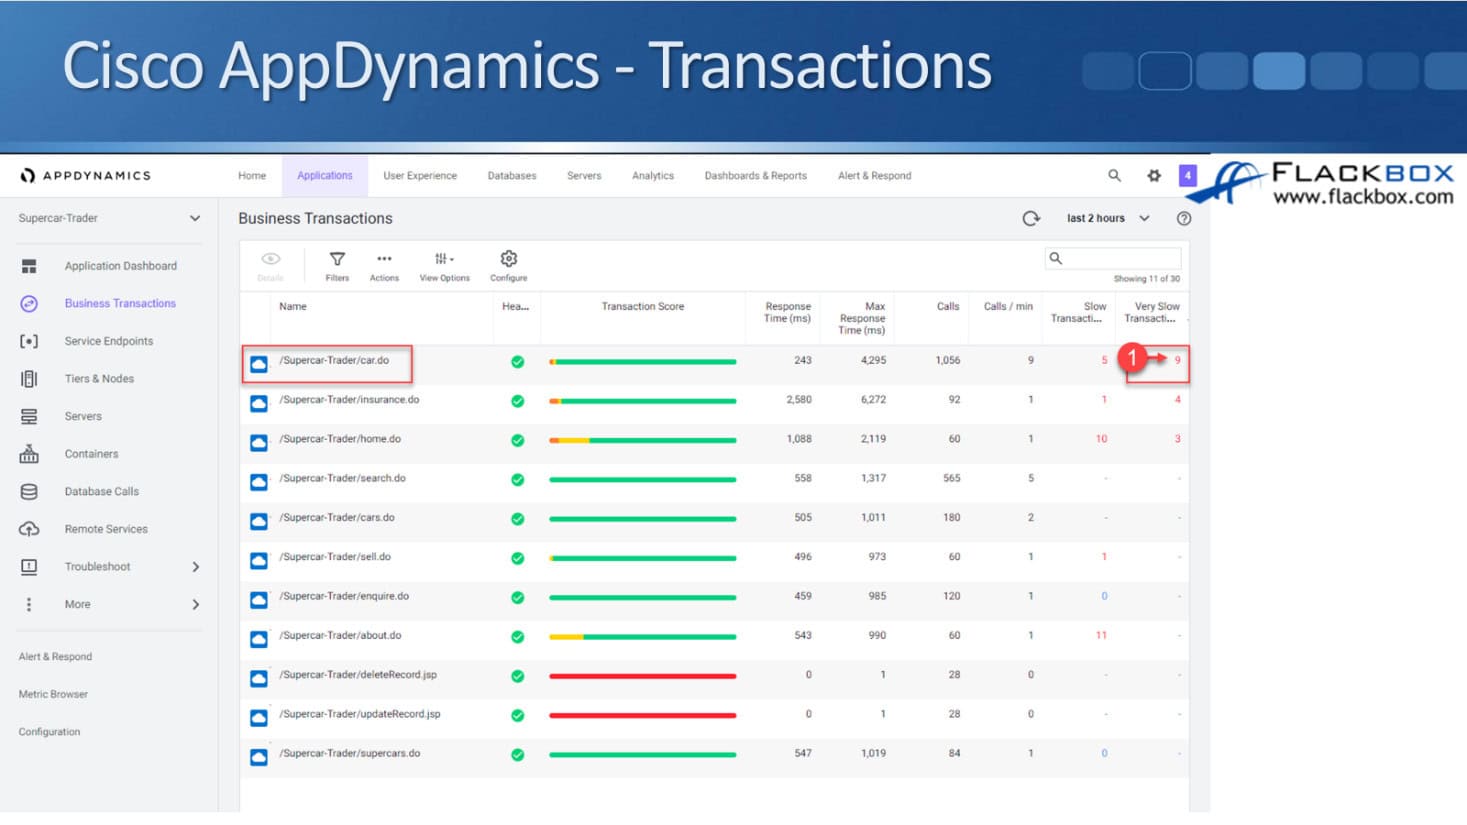
A couple here are all red, so that is bad. Looking at the response time, it's 0. So, it looks like those parts have actually failed. You can also click on very slow transactions.
If your users report any issues with the application, or if you take proactive measures yourself, you can identify any issues within the application and pinpoint their exact location.
Cisco ThousandEyes
Cisco ThousandEyes is cloud-managed, so it always runs on the Cloud Monitoring and Troubleshooting platform, which is designed for organizations with complex distributed networks and applications on the cloud or across the Internet.
Therefore, ThousandEyes can be extremely helpful if you have applications that you're accessing through a cloud provider or if your users are accessing them over the Internet, possibly from distributed locations.

It monitors internal network availability and performance and external network availability and performance as well. It also monitors external ISPs and cloud providers.
This is really a big selling point of that application, because when you're working as a network engineer, you're going to run into these problems where you've got problems with your applications and the users are connecting over the network, and maybe it's going through the Internet, and you're not sure if the problem is internal in your network or if it's a service provider.
You will often troubleshoot everything on your network. When you are unable to identify any issues, you reach out to your service provider, only to have them respond, "We don't have any issues either." You then kind of reach a roadblock with your troubleshooting. It can be very difficult.
ThousandEyes is really useful for that because it can help identify exactly where the problem is internal or external. It helps identify the root cause of application performance problems as originating from inside your network, such as the application itself or external dependencies such as your ISP or cloud provider.
Its security monitoring features include detection of anomalies, Distributed Denial of Service (DDoS), and DNS-based attacks.
Cisco ThousandEyes Agents
Monitoring agents provide statistics and different vantage points for tests. The agents are installed on your network infrastructure devices and your endpoints.
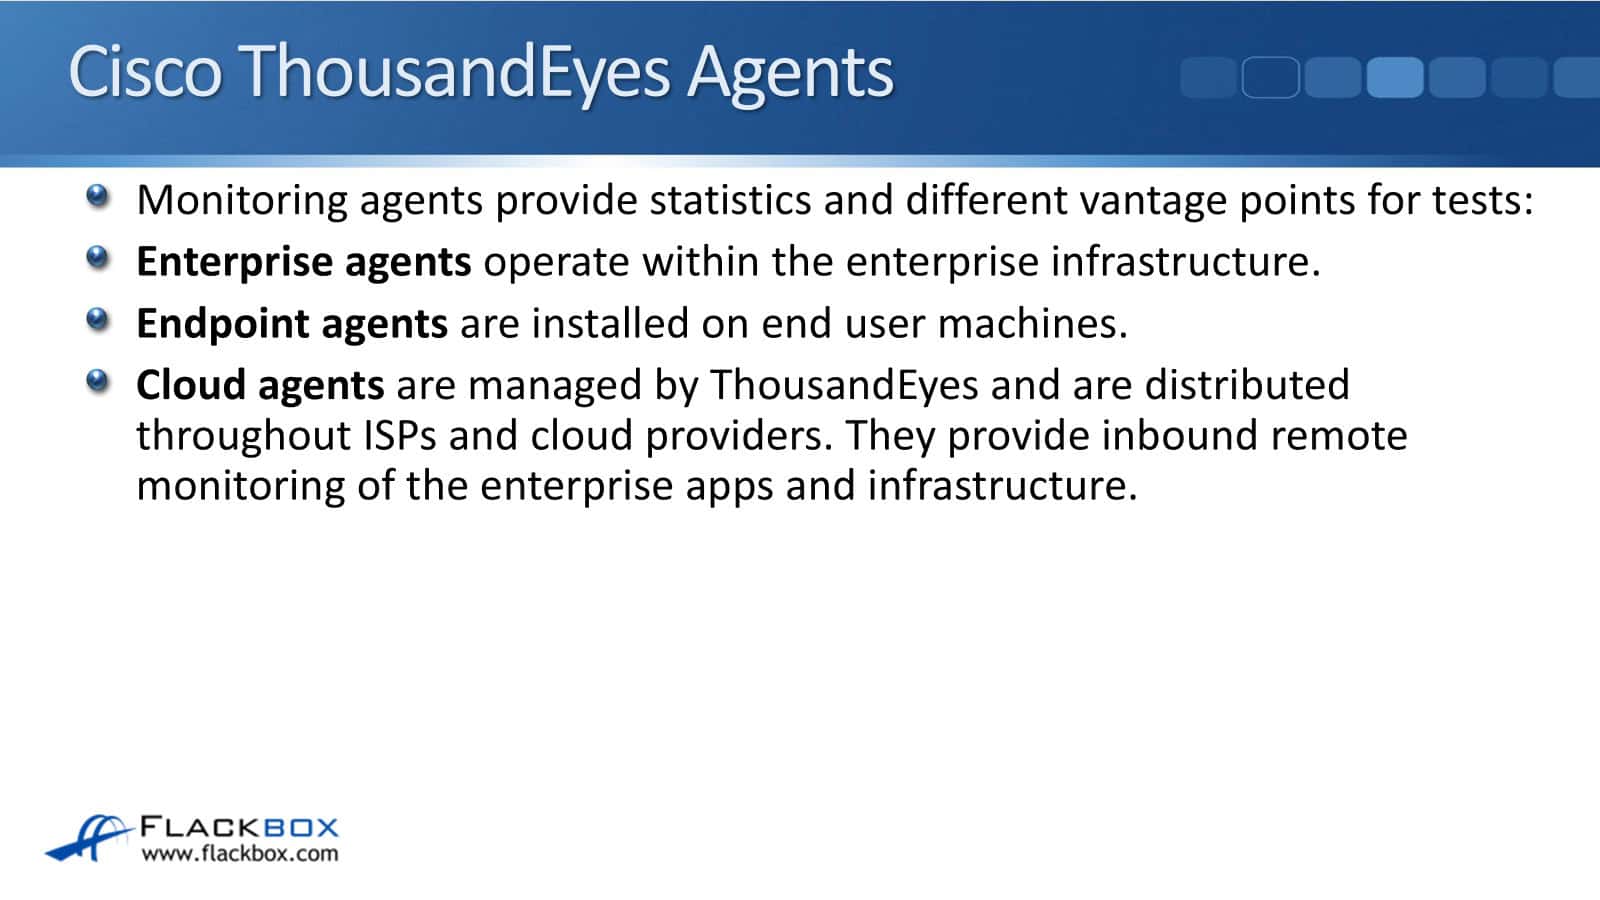
There are three different types of agents. First, the enterprise agents that operate within the enterprise infrastructure. They are installed on your switches, and your routers actually use SNMP to report statistics from your network devices to the cloud. Once it's installed, you can also run tests from your routers and switches directly into the application.
Second, endpoint agents are installed on your end-user machines, for example, Windows desktops. They can then provide statistics on things like the user's response time, and you can also run tests from this location.
More likely, you're going to run tests from an endpoint rather than from a network device. So that way you can say that your application is with a cloud provider. You can run a test from a desktop, and you will see the performance of that application.
Third, the cloud agents. ThousandEyes manages them, not you. They're distributed throughout ISPs and cloud providers. They provide inbound remote monitoring of the enterprise apps and infrastructure.
ThousandEyes has installed these cloud agents in numerous locations across the Internet. They not only monitor the locations where they have installed their agents, but they also engage in passive monitoring.
So even if they don't have an agent in a particular ISP, they can still monitor the performance and any issues within that ISP. Therefore, they provide statistics of end-to-end traffic as it travels across the internet and through cloud providers.
With those external cloud agents, you can use them for running tests, so you can run a test from outside on the Internet into applications that are internal inside your enterprise.
Cisco ThousandEyes AI and ML
ThousandEyes agents located across the Internet perform billions of measurements each day using Machine Learning, creating a massive data set on when and where traffic flows are disrupted at the network interface and application server levels. Thus, it can detect if there is a problem out on the Internet somewhere.
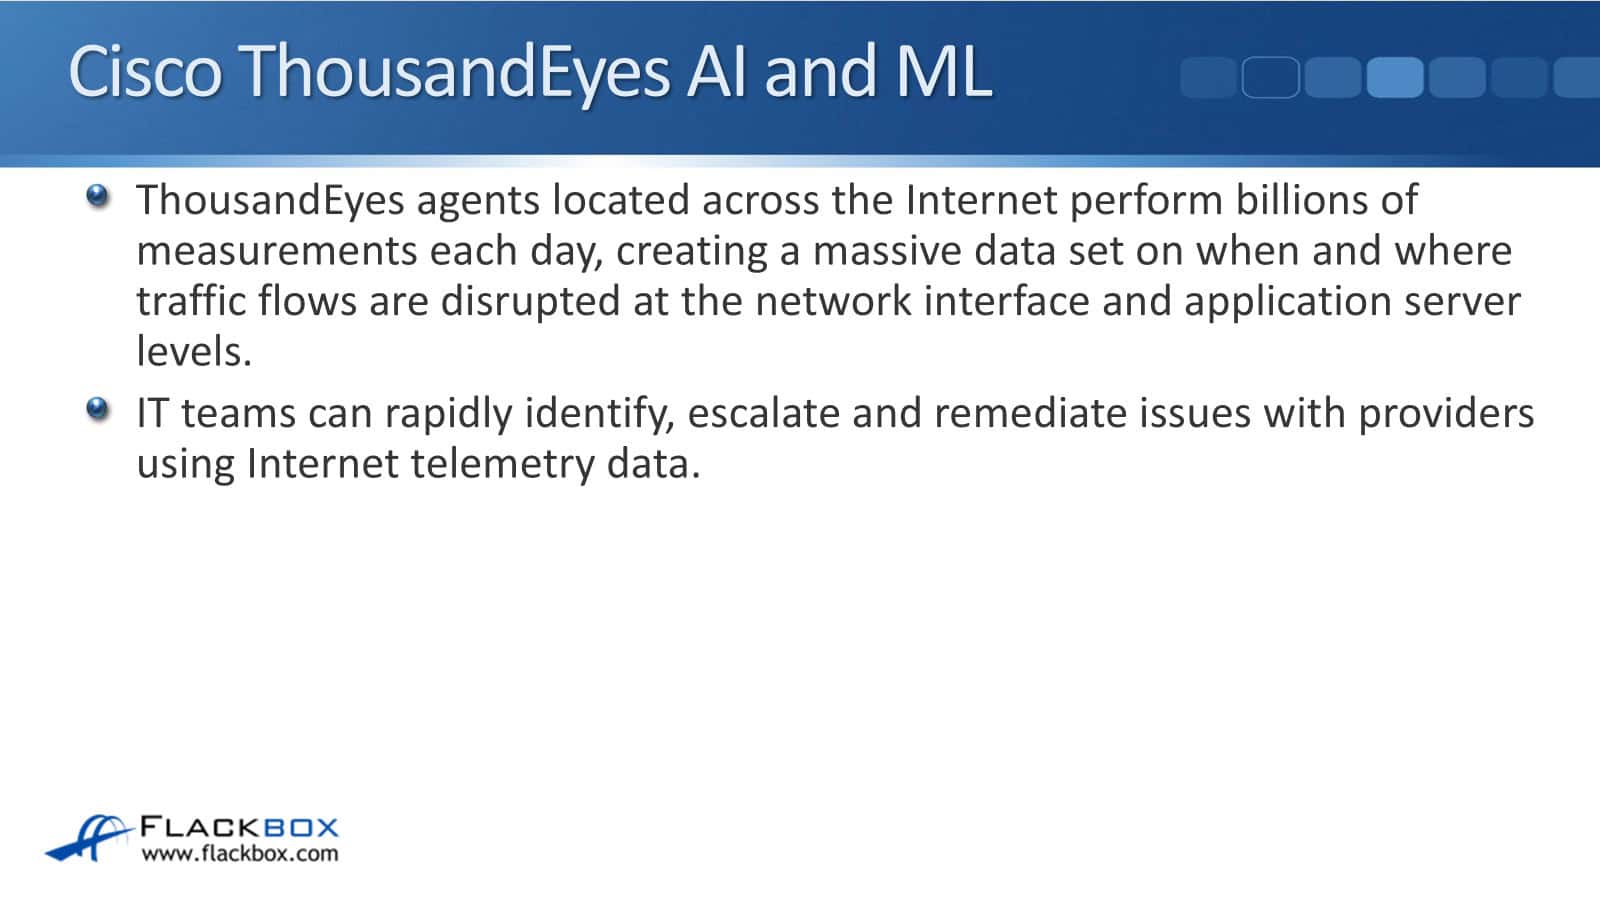
IT teams can quickly identify, escalate, and resolve issues with providers using Internet telemetry data. Therefore, when you have that issue, there's a problem with a particular application, and before you knew it, you weren't sure if it was internal in your network or with your service provider.
Now you can clearly identify the service provider's issue and provide evidence. So when you contact the service provider, you can show them, “Hey, this is exactly where the problem is.” They're not going to just follow you off and say, "No, the problem's not with us."
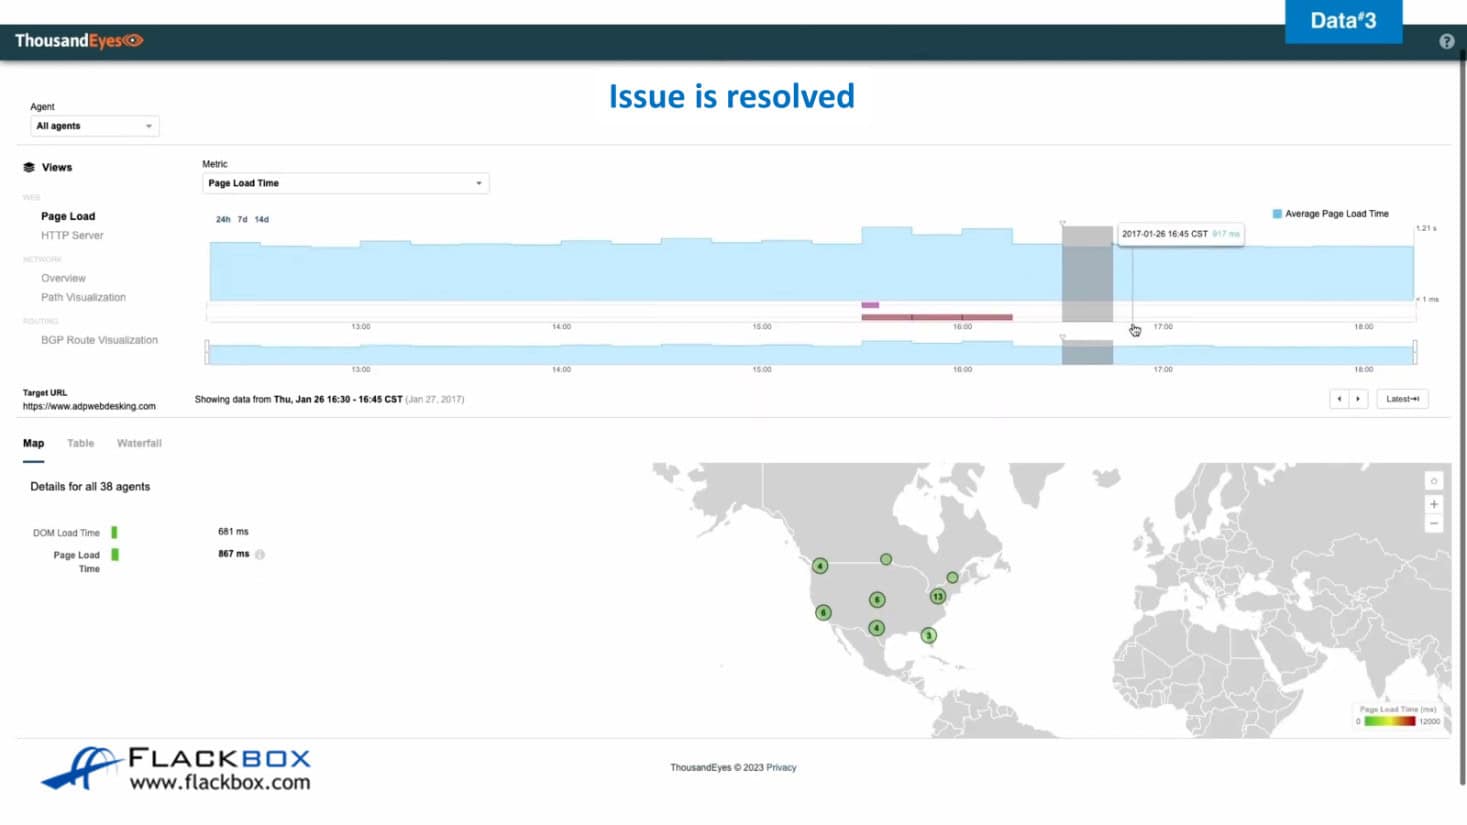
As an example, consider the company ADP, which operates a web application at adpwebdeking.com. The sales team logs into the application to upload their sales data. Now, what's happened is that some sales staff are reporting that they weren't able to reach your application, so you're losing sales.
Therefore, you go to ThousandEyes, and you take a look at that application. You've got these agents, which are external places out on the Internet. In this scenario, your sales staff is also located in remote offices. They're connecting to you over the Internet, so you're monitoring it from different Internet locations.
From those 38 locations you're monitoring, 4 have errors and can't connect.
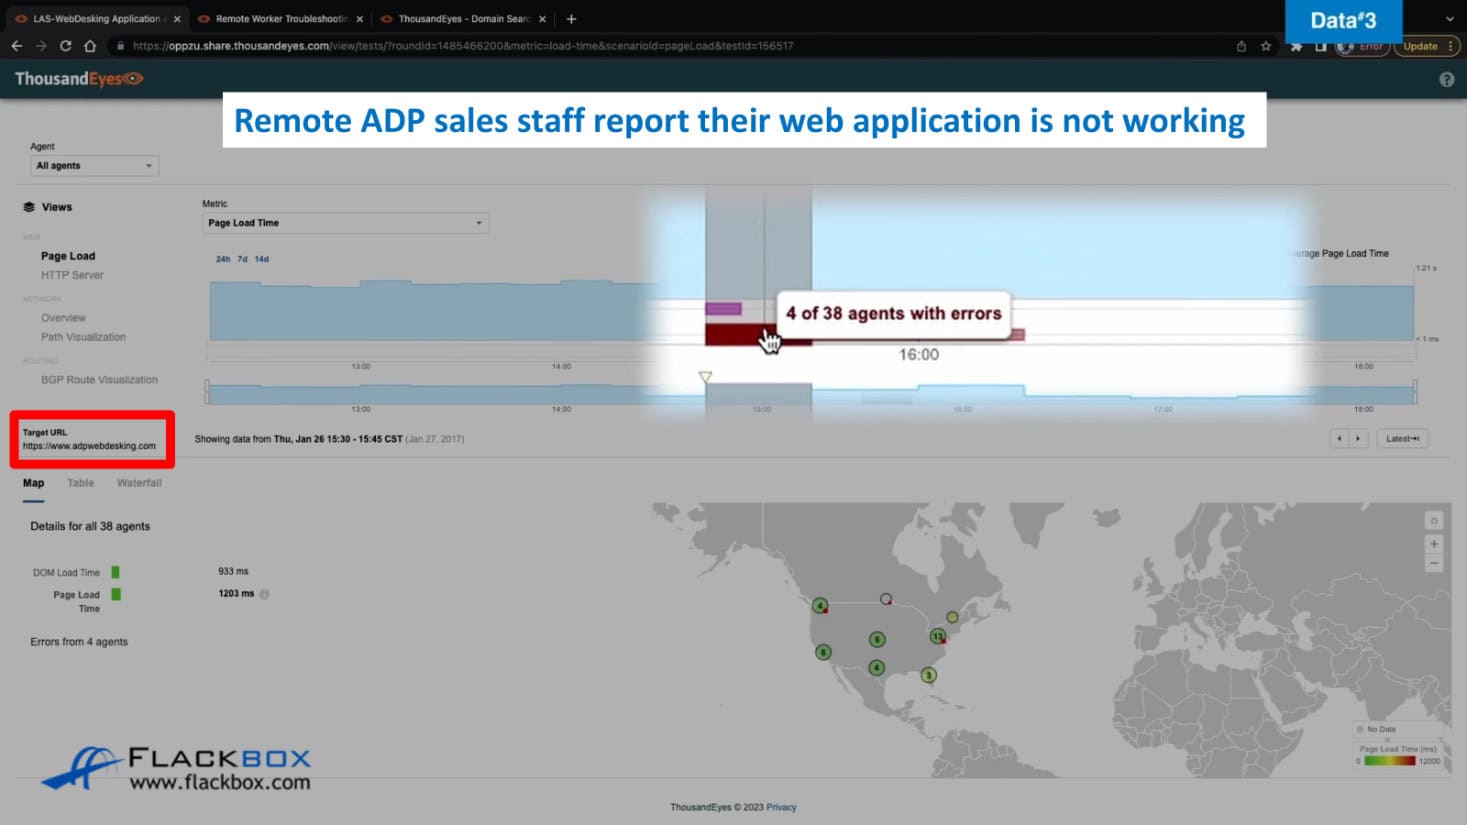
What you do next is click on the red part here, and then that will drill down. Now, we can see that we have agents at these different locations, and all of them are unable to reach our application over here.
Here, we're on the path visualization tab, and we can see the problem. We can then see that the problem seems to be concentrated here. All of them are getting that far, and then that is where the outage is, and that's why they're not able to reach the application with us.
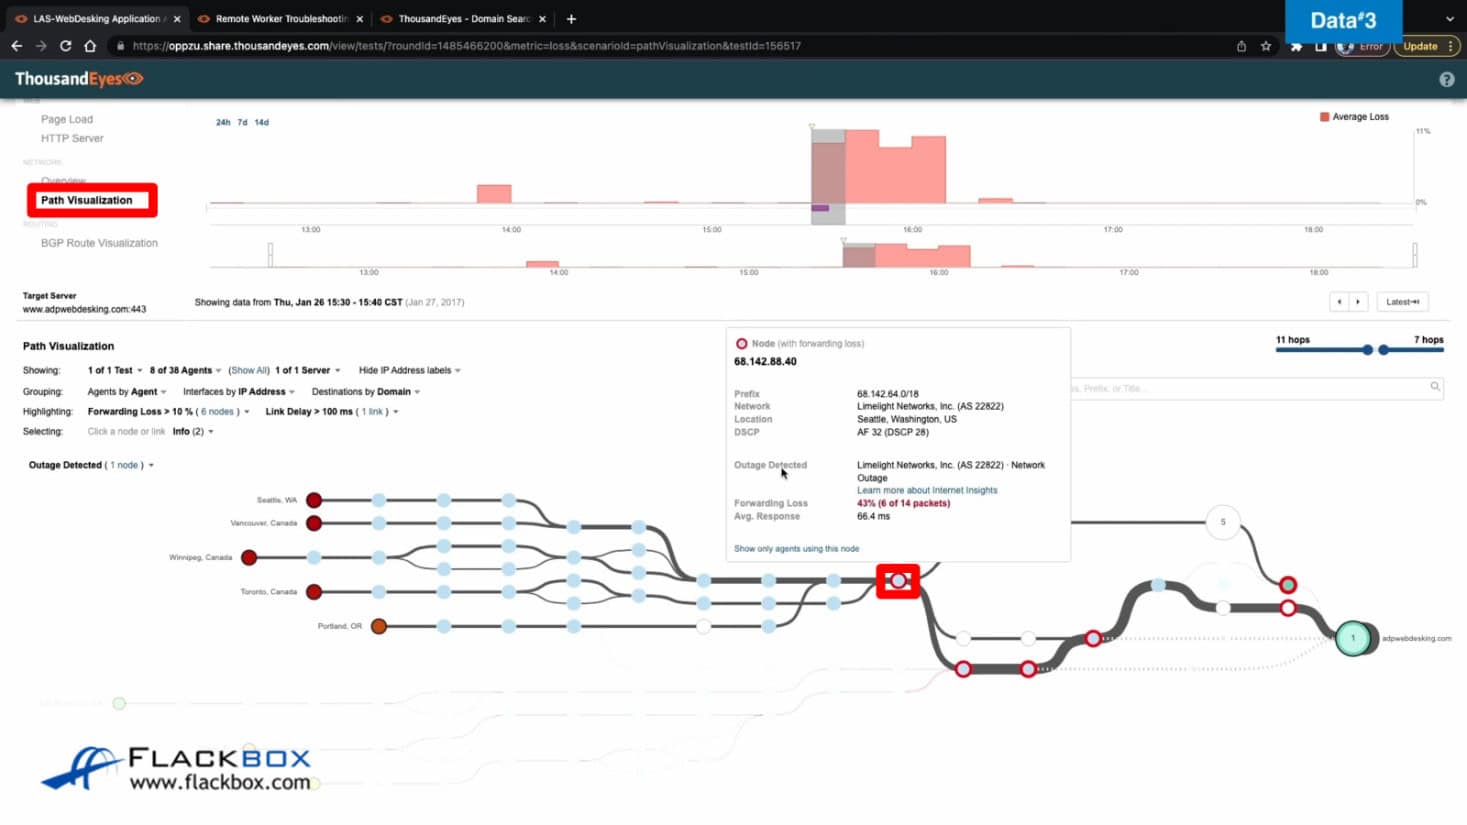
We're over here on the right. We can hover over this part of the diagram here, and we can see that the network is Limelight Networks, and it looks like they've had an outage. We can then go to the BGP Route Visualization tab.
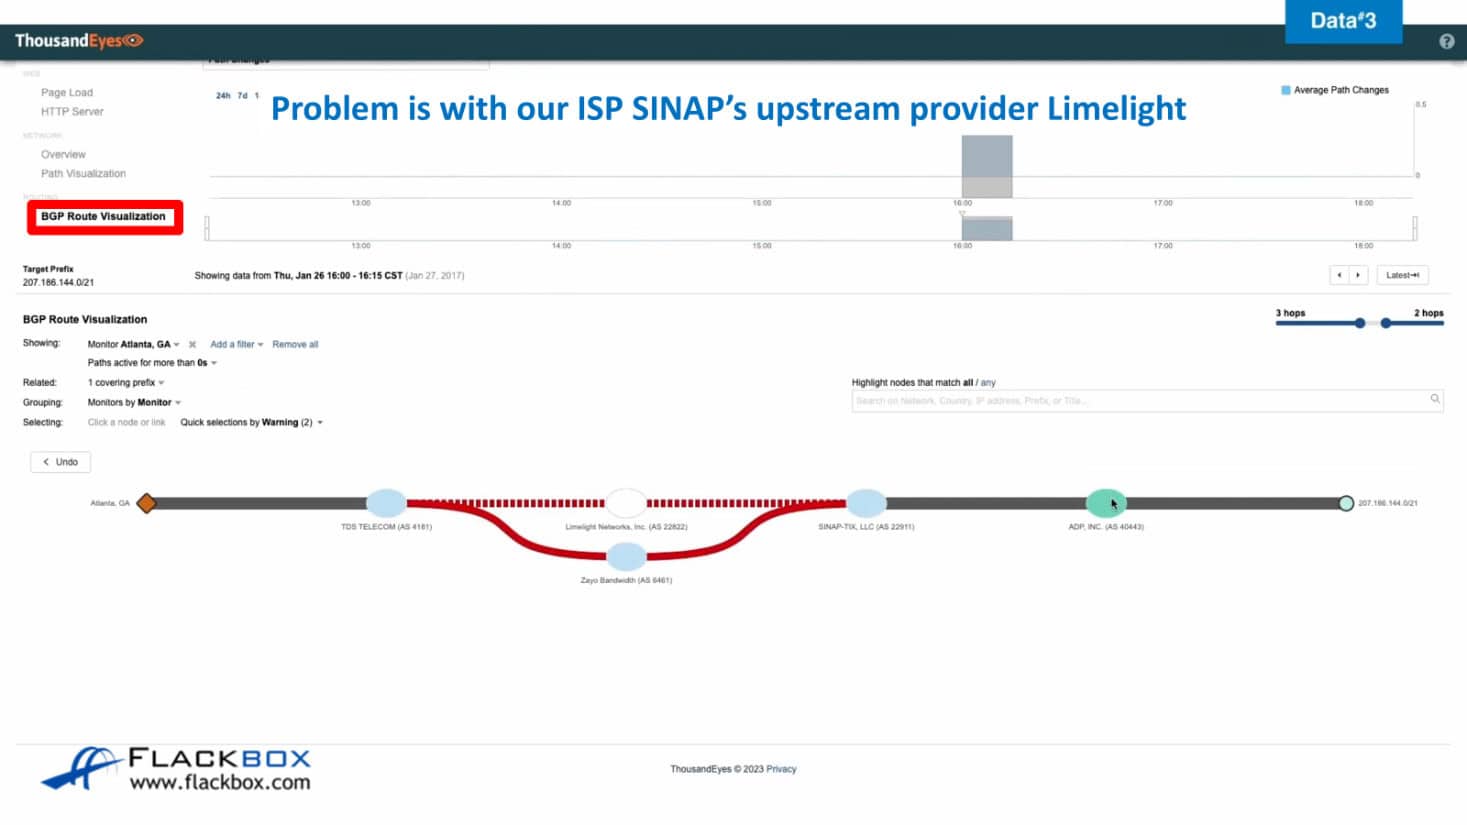
Here's us on the right again. We are ADP, and our Internet service provider is SINAP. This indicates a potential issue with their upstream provider, Limelight Networks. They're also appearing with 0, and that one appears to be fine.
So we get in touch with our ISP, sign up, and we tell them about the problem. We can also relay this information to them, enabling them to identify the issue with their upstream connection to Limelight.
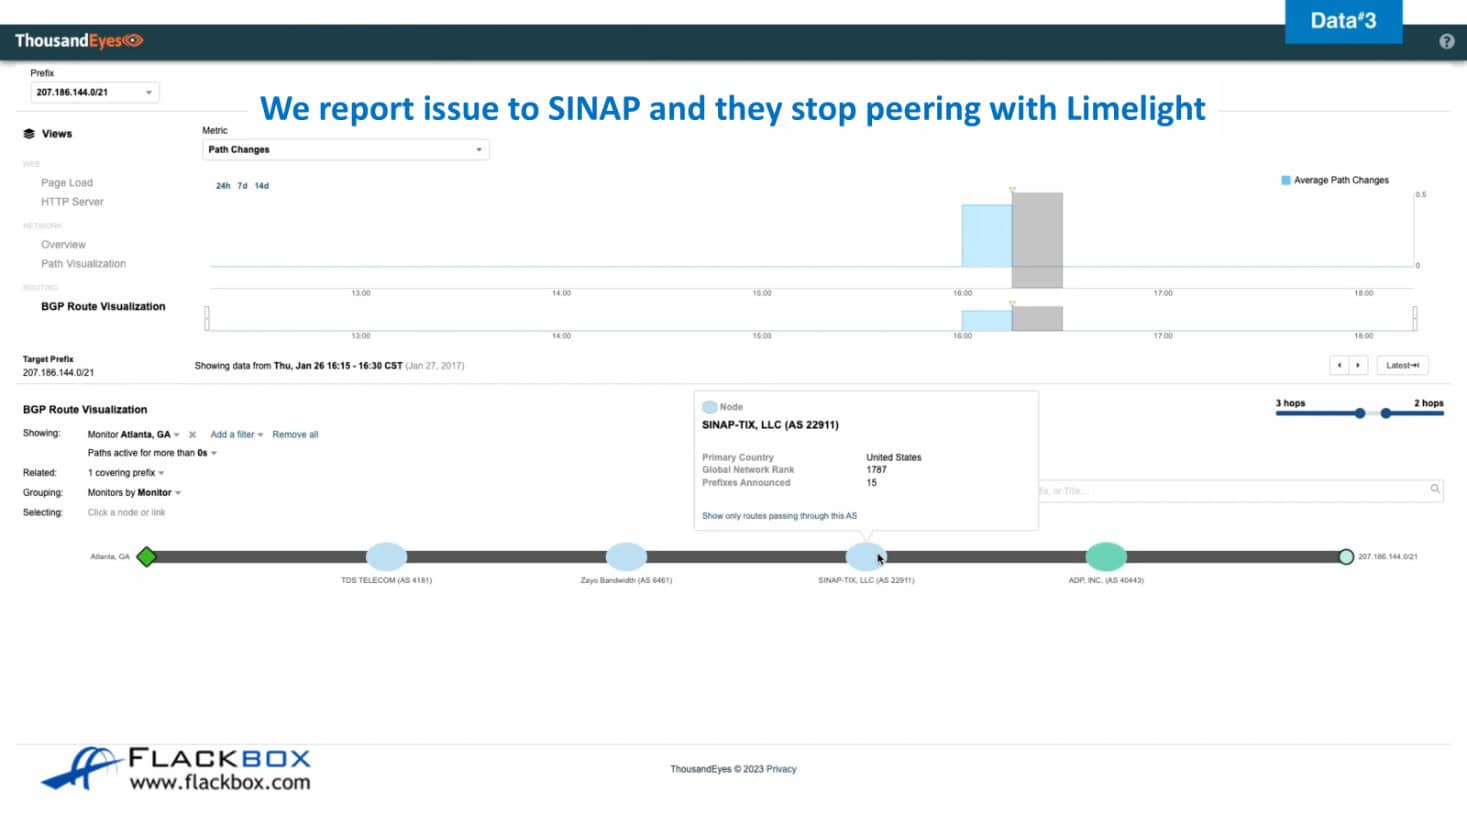
We have reported the issue to them, and they have stopped using Limelight until Limelight resolves their issue. They're only using Zayo now, and now this looks good.
Looking back at the monitoring, we can see that all of our agents are now green, indicating that the issue has been resolved. This is the benefit of using ThousandEyes, as it not only monitors external networks but also your own network.
Cisco Secure Network Analytics
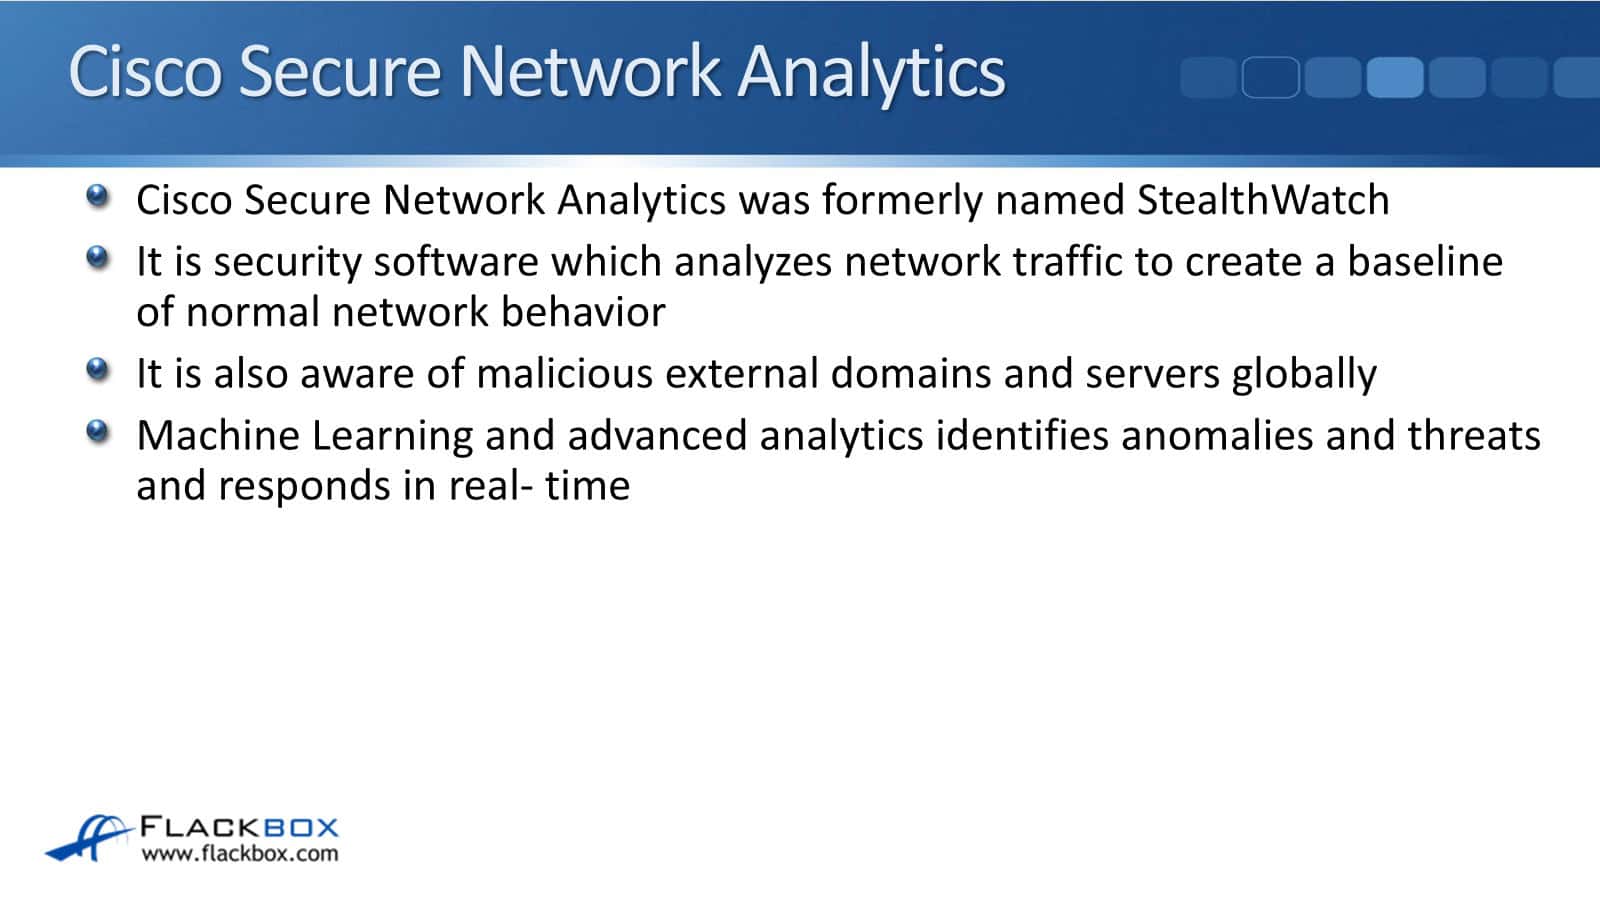
Cisco Secure Network Analytics was formerly named StealthWatch. It is a security software that analyzes network traffic to create a baseline of normal network behavior. It's also aware of malicious external domains and servers globally.
It is kind of similar to ThousandEyes, but ThousandEyes is actually more detailed. It doesn't just focus on security. It also looks at network traffic statistics in general.
Cisco Secure Network Analytics is looking for malicious external domains and servers. It's not doing with detailed network analysis of their traffic. Machine Learning and advanced analytics identify anomalies and threats and can respond in real-time.
Threats include command-and-control attacks. This is where somebody sends malware to one of your users. Once they install it, an external attacker gains remote control of their machine.
Other threats include ransomware, Distributed Denial of Service (DDoS), and unknown malware, which is not using signatures, and it can also be insider threats. It does monitor your internal network as well.
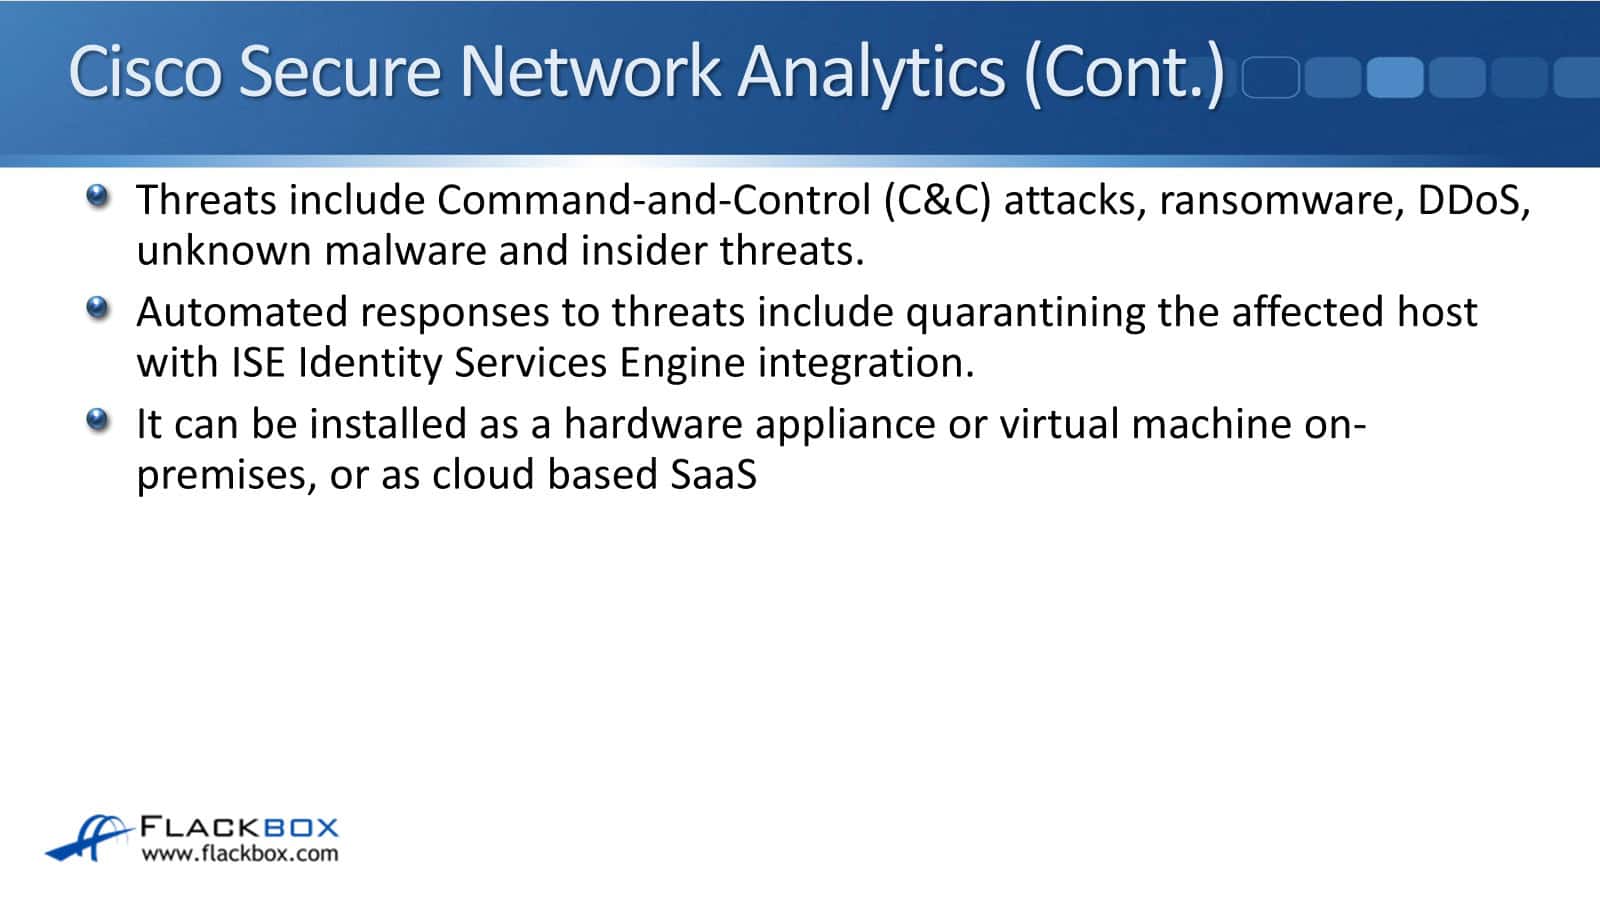
Automated responses to threats include quarantining the affected host if you've got the Identity Services Engine (ISE) integration. ISE is another security product from Cisco, and it's actually capable of shutting down ports, also changing VLANs, and creating dynamic access lists so it can take hosts off the network.
You can install Cisco Secure Network Analysis as a hardware appliance, virtual machine, on-premises, or as a cloud-based SaaS.
ML in Cisco Secure Network Analytics
Cisco Secure Network Analytics uses Machine Learning for contextual network-wide visibility, predictive analytics, and automated detection and response.
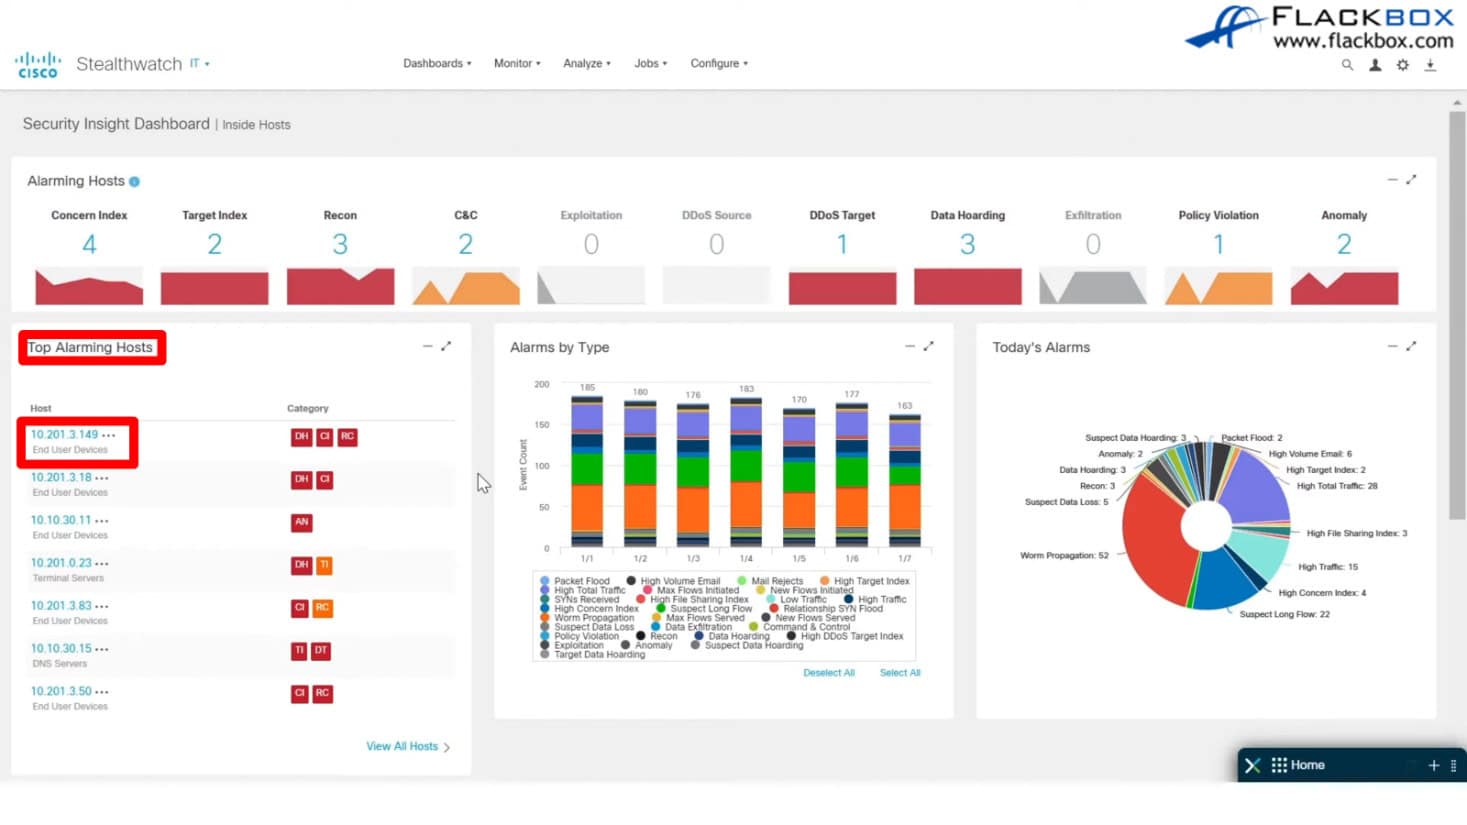
Looking at an example of this, here we are on the dashboard. Red is bad, so we can see that we have got some threats being reported there. We can also look at the top alarming hosts, and we're going to have a look at this top one here. We can click on that to drill down into that particular host.
When we do that, you see it's got automatic grouping as well. It uses Machine Learning and AI to automatically put that host into relevant groups. It does this automatically. You don't need to do it manually.
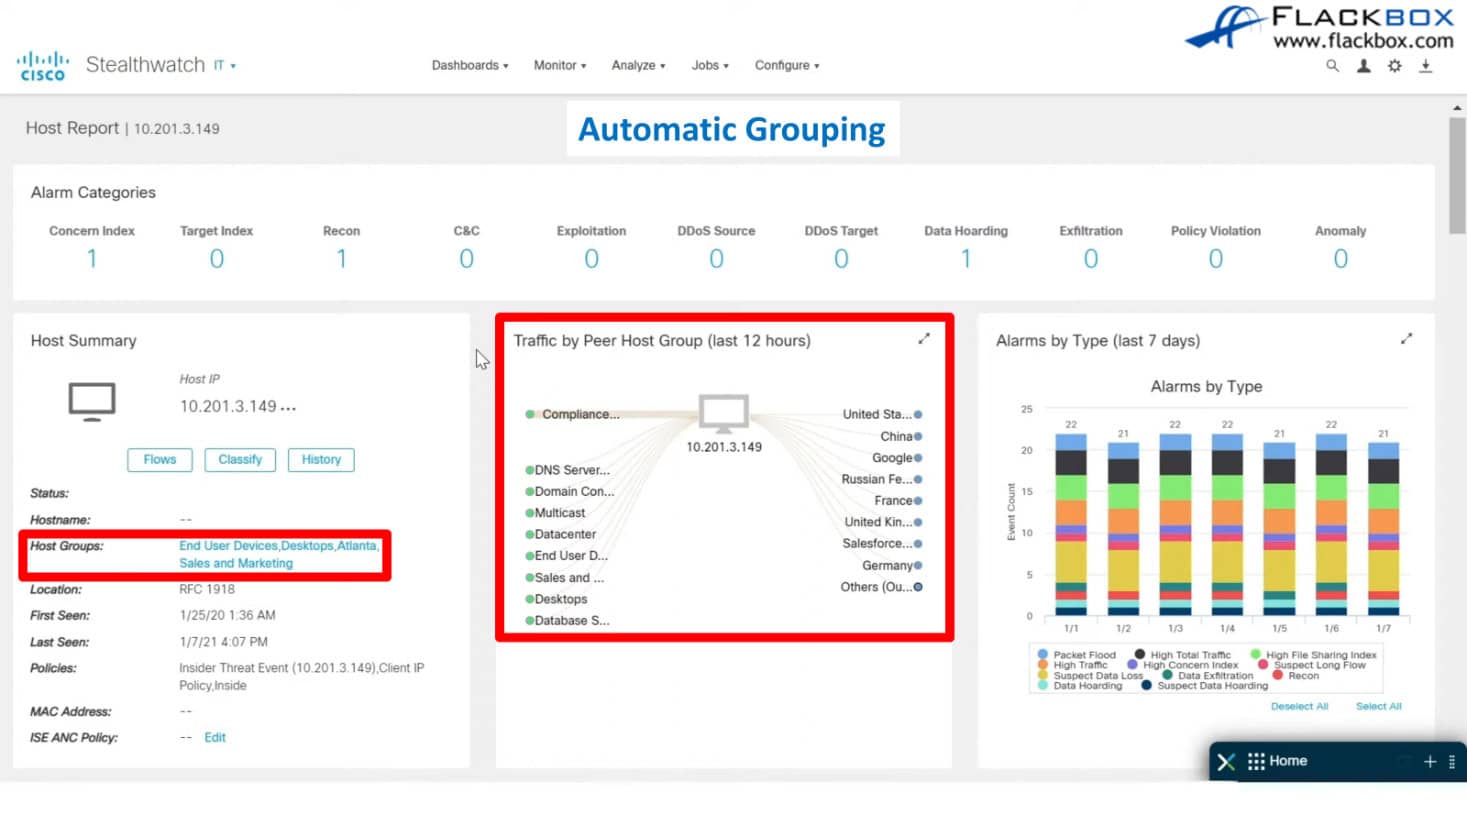
It is automatically grouped that host into end-user devices, desktops, Atlanta, and its Sales and Marketing Machine. It also groups external destinations automatically. We can see it's done that by country, also by large companies such as Google and Salesforce as well.
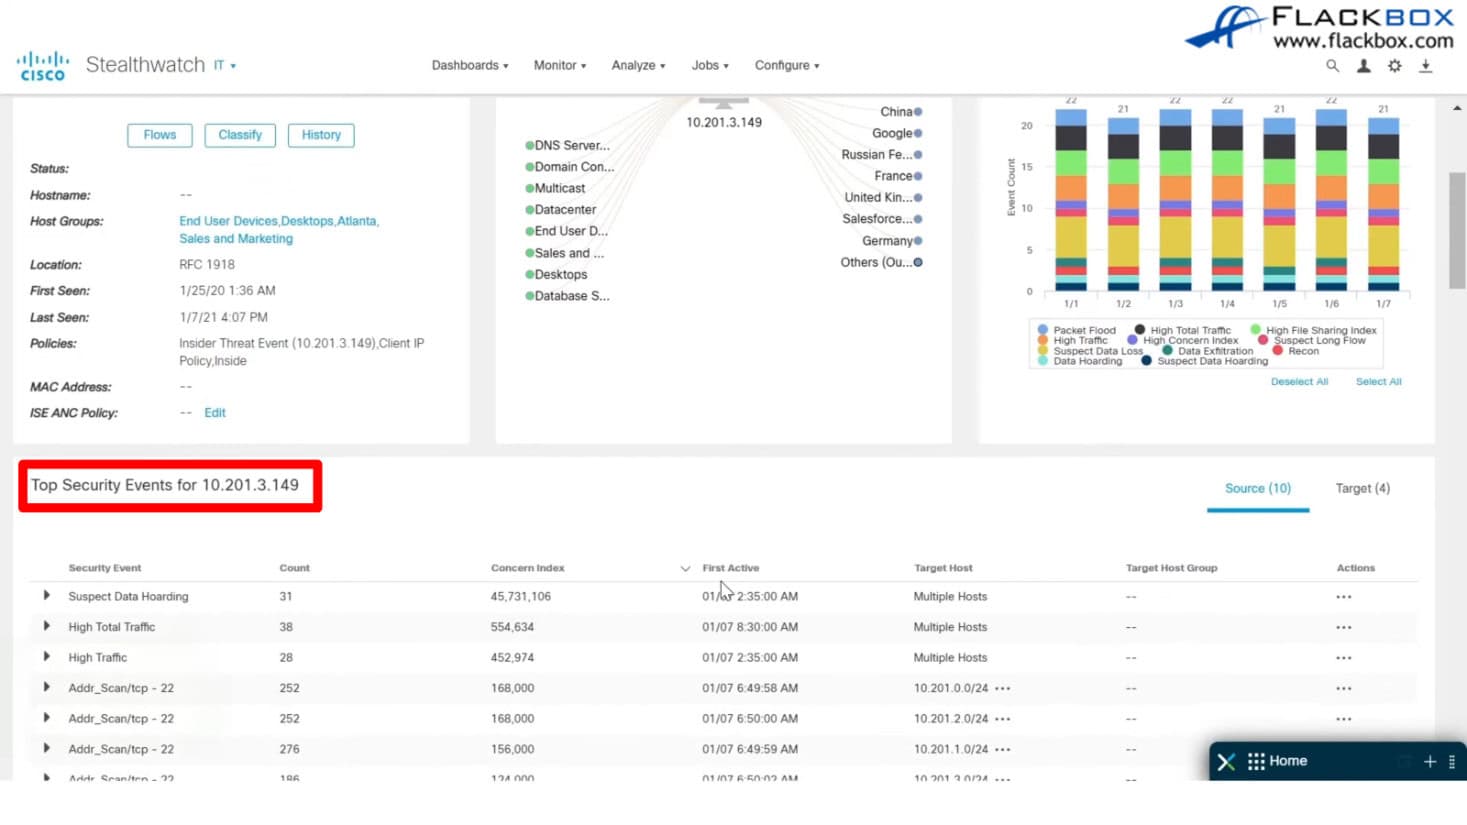
We can scroll down on that page, and then we can see the top security events for that particular host, and we can click on any of those to drill down further into that. Here we've drilled down into a particular alert, and we can see that it is malware ransomware.
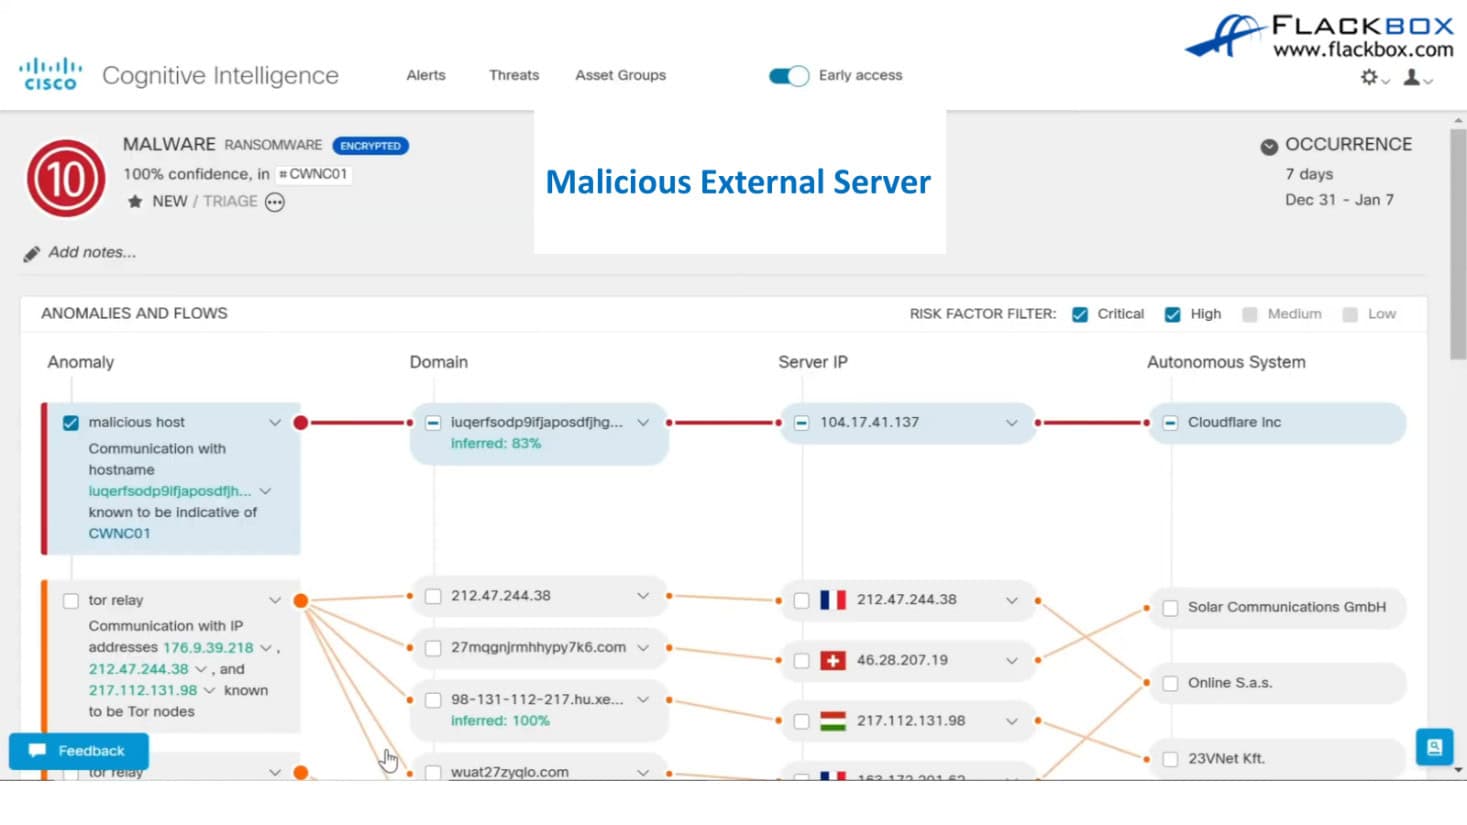
As you can see, this is the malicious host. The software knows about malicious external domains and servers. If the software detects traffic coming from these malicious external domains and servers, it will automatically flag a problem, which is exactly what happened in this case.
When we see that, we can click the host. If we have the ISE installed, we can quarantine the host. Therefore, we isolate the host from the network until we can manually disinfect and remove the malware.
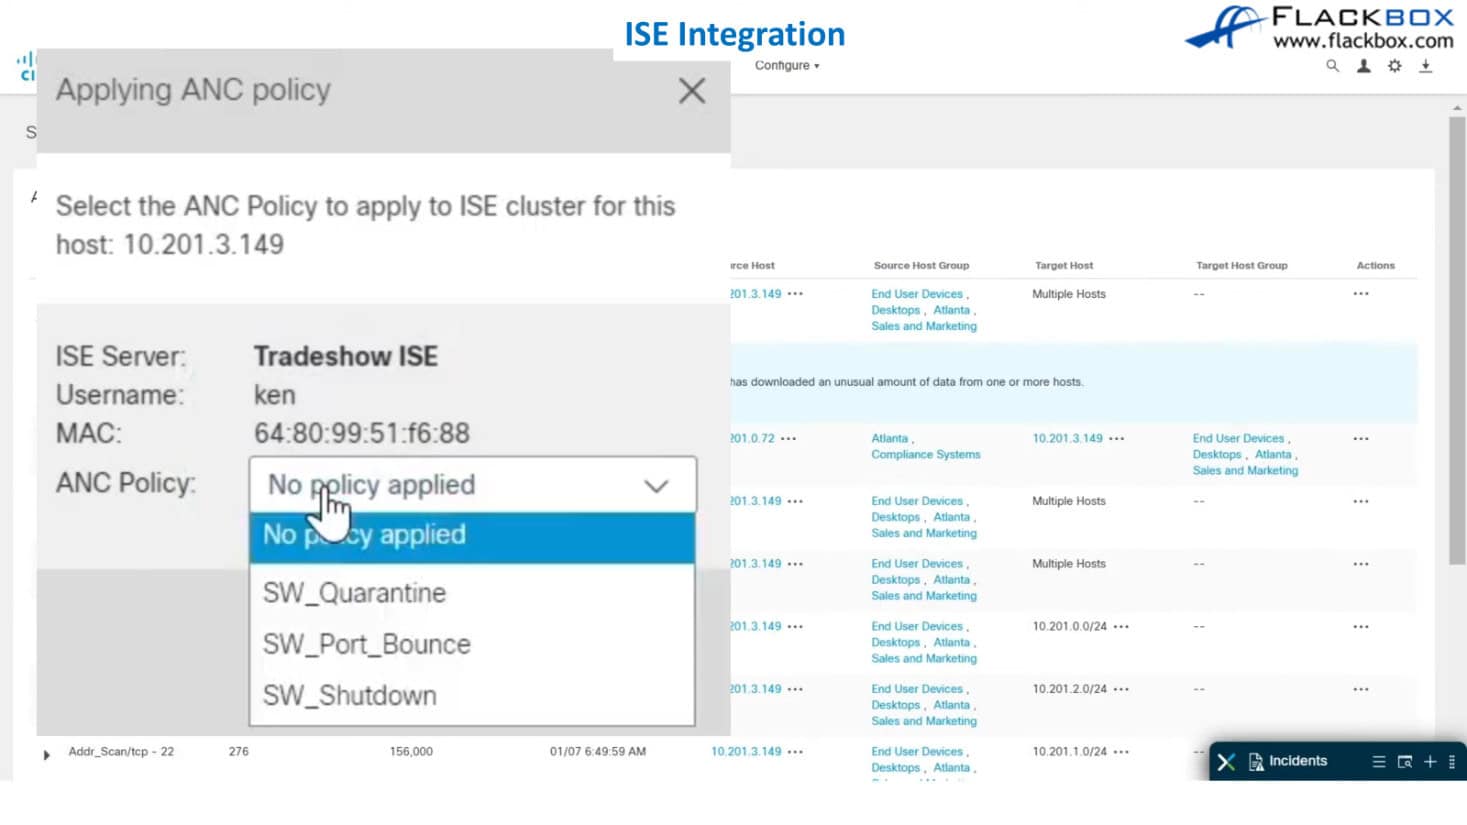
It also supports Automated Response Management. In the response management, you can see that there are preconfigured rules such as Block Roque DHCP server from the network. You also have the option to add your own custom rules. Therefore, you create a rule saying this particular threat has been detected.

You can specify the different group you want it to apply to as well. For example, you don't want it to apply to your servers, only to your end users. You specify the rule, and then the same options appear again in the action.
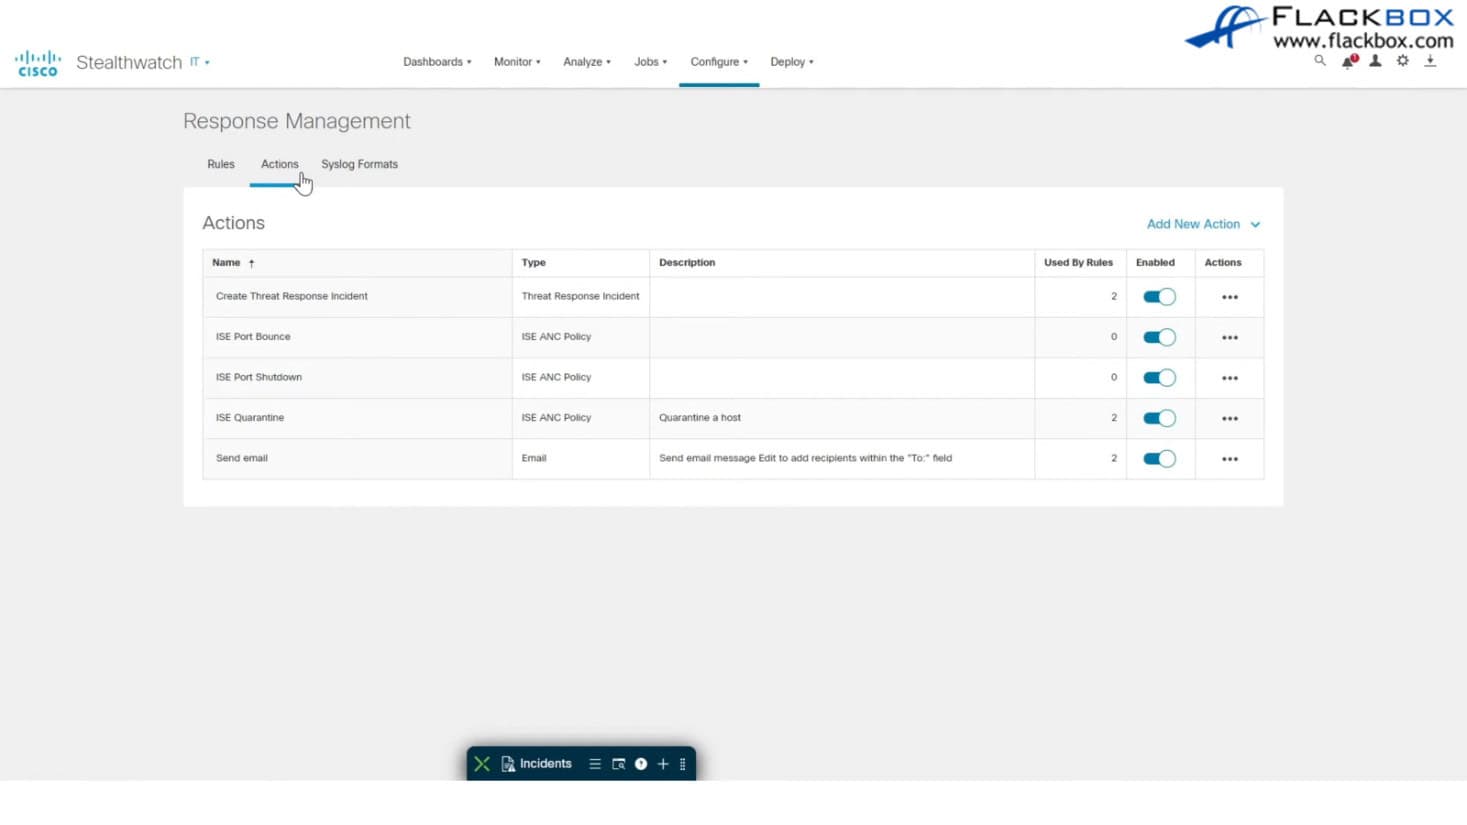
Next, you have the option to either reboot the port, shut it down using ISE, or quarantine it. Take the host off the network. You can also send yourself an email so you get an automated email notification anytime that there is a particular threat that you're particularly interested in, and you can also create a threat response incident inside the software.
Further Learning Resources on Cisco.com
That was all of the different Cisco products covered in the CCNA, which are using ML and AI. If you want to get practice with any of those, you'll see that there are learning labs in the DevNet Sandbox and the DevNet Learning Labs.
Additional Resources
Cisco Network AI and ML Overview: https://www.flackbox.com/cisco-network-ai-ml-overview
What Is AIOps?: https://www.cisco.com/c/en/us/solutions/artificial-intelligence/what-is-aiops.html
Cisco AI Solutions: https://www.cisco.com/site/us/en/solutions/artificial-intelligence/index.html
AI and Machine Learning: https://www.cisco.com/c/en/us/solutions/collateral/enterprise-networks/digital-network-architecture/nb-06-cisco-dna-ai-ml-primer-cte-en.html
Libby Teofilo

Text by Libby Teofilo, Technical Writer at www.flackbox.com
Libby’s passion for technology drives her to constantly learn and share her insights. When she’s not immersed in the tech world, she’s either lost in a good book with a cup of coffee or out exploring on her next adventure. Always curious, always inspired.